Why is an electrocardiogram performed?
After examination by a cardiologist, the examination begins with electrocardiography. This procedure is very informative, despite the fact that it is carried out quickly and does not require special training or additional costs.
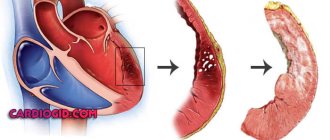
The cardiograph records the passage of electrical impulses through the heart, records the heart rate and can detect the development of serious pathologies. The waves on an ECG give a detailed picture of the different parts of the myocardium and how they work.
The norm for an ECG is that different waves differ in different leads. They are calculated by determining the value relative to the projection of the EMF vectors onto the lead axis. The tooth can be positive or negative. If it is located above the cardiography isoline, it is considered positive, if below it is considered negative. A biphasic wave is recorded when, at the moment of excitation, the wave passes from one phase to another.
Important! An electrocardiogram of the heart shows the state of the conduction system, consisting of bundles of fibers through which impulses pass. By observing the rhythm of contractions and the characteristics of rhythm disturbances, one can see various pathologies.
The conduction system of the heart is a complex structure. It consists of:
- sinoatrial node,
- atrioventricular,
- bundle branches,
- Purkinje fibers.
The sinus node, as a pacemaker, is a source of impulses. They are formed at a rate of 60-80 times per minute. With various disorders and arrhythmias, impulses may be created more often or less frequently than normal.
Sometimes bradycardia (slow heartbeat) develops due to the fact that another part of the heart takes over the function of the pacemaker. Arrhythmic manifestations can also be caused by blockades in various zones. Because of this, the automatic control of the heart is disrupted.
What is a cardiogram?
The cardiogram graphically shows the electrical processes occurring in the heart muscle, or more precisely, the excitation (depolarization) and restoration (repolarization) of muscle tissue cells.
The impulse is carried out through the conduction system of the heart - a complex neuromuscular structure consisting of the sinoatrial, atrioventricular nodes, legs and bundles of His, turning into Purkinje fibers (their location is shown in the figure). The cardiac cycle begins with the transmission of an impulse from the sinoatrial node, or pacemaker. It sends a signal 60–80 times per minute, which is equal to the normal heart rate in a healthy person, then to the atrioventricular node.
In case of pathologies of the sinoatrial node, the main role is played by the AV node, whose pulse frequency is approximately 40 per minute, which causes bradycardia. Next, the signal passes into the His bundle, consisting of the trunk, right and left legs, which, in turn, pass into the Purkinje fibers.
The conduction system of the heart ensures the automaticity and correct sequence of contractions of all parts of the heart. Pathologies of the conduction system are called blockades.
Using an ECG, you can identify many indicators and pathologies, such as:
- Heart rate and rhythm.
Damage to the heart muscle (acute or chronic).- Blockades in the conduction system of the heart.
- General condition of the heart.
- Metabolism disorders of various elements (calcium, magnesium, potassium).
- Detection of pathologies not related to the heart (for example, embolism of one of the pulmonary arteries). What does this analysis consist of? An ECG has several elements: waves, segments and intervals. They show how an electrical impulse travels through the heart.
Also included with the cardiogram is a determination of the direction of the electrical axis of the heart and knowledge of the leads. Teeth are convex or convex sections of the cardiogram, designated in capital Latin letters.
A segment is a part of an isoline located between two teeth. Isoline is a straight line on a cardiogram. Interval - a tooth together with a segment.
As can be seen from the figure below, the ECG consists of the following elements:
- Wave P - reflects the spread of the impulse through the right and left atrium.
- PQ interval is the time it takes for an impulse to travel to the ventricles.
- The QRS complex is the excitation of the ventricular myocardium.
- The ST segment is the time of complete depolarization of both ventricles.
- The T wave is ventricular repolarization.
- QT interval – ventricular systole.
- The TR segment reflects the diastole of the heart.
ECG interpretation
Leads are an integral part of the analysis. Leads are the potential difference between points that are needed for a more accurate diagnosis. There are several types of leads:
- Standard leads (I, II, III). I – potential difference between the left and right hand, II – right hand and left leg, III – left hand and left leg.
- Reinforced leads. A positive electrode is placed on one of the limbs, while negative electrodes are placed on the remaining two (there is always a black electrode on the right leg - grounding).
There are three types of enhanced leads - AVR, AVL, AVF - from the right arm, left arm and left leg, respectively.
- Chest leads:
- V1-electrode is placed to the right of the sternum in the fourth intercostal space;
V2 – the electrode is applied to the left of the sternum in the fourth intercostal space;- V3 – placed between the left sternal and left mediaclavicular line in the fourth intercostal space;
- V4 – an electrode is placed in the fifth intercostal space along the left mediaclavicular line;
- V5 – in the fifth intercostal space along the left anterior axillary line;
- V6 – in the fifth intercostal space along the left mid-axillary line.
What does an ECG show?
If you know the norms for cardiogram indicators, how the teeth should be located in a healthy person, you can diagnose many pathologies. This examination is carried out in a hospital setting, on an outpatient basis and in emergency critical cases by emergency doctors to make a preliminary diagnosis.
Changes reflected in the cardiogram may show the following conditions:
- rhythm and heart rate,
- myocardial infarction damage,
- blockade of the conduction system of the heart,
- disruption of the metabolism of important microelements,
- blockages of large arteries.
Obviously, research using an electrocardiogram can be very informative. But what do the results of the data obtained consist of?
Attention! In addition to waves, the ECG pattern has segments and intervals. Knowing what the norm is for all these elements, you can make a diagnosis.
ECG waves and intervals: first acquaintance
Each wave on the electrocardiogram has its own designation. There are no these marks on the thermal paper itself, since they are needed only for discussing the diagnosis or recording in the patient’s hospital record.
Arrangement of teeth and intervals
The list of teeth includes convexities and concavities, which have names:
- P – beginning of atrial contractions;
- Q, R, S – belong to the same group, relate to the contraction of the ventricles;
- T – period of ventricular relaxation;
- U – this wave is recorded extremely rarely.
In addition, there is a division of the cardiogram into segments and intervals.
The straight line dividing the teeth is called a segment (or isoline). Their size indicates the presence of a delay in the excitation of any area. When diagnosing, special attention is paid to the PQ and ST segments.
The interval includes teeth and segments. The length of the interval can also say a lot. The most significant from a diagnostic point of view are the PQ and QT intervals.
An example of a possible deviation from the norm
Detailed interpretation of the electrocardiogram
The norm for the P wave is located above the isoline. This atrial wave can be negative only in leads 3, aVL and 5. In leads 1 and 2 it reaches its maximum amplitude. The absence of a P wave may indicate serious disturbances in the conduction of impulses through the right and left atrium. This tooth reflects the state of this particular part of the heart.
The P wave is deciphered first, since it is in it that the electrical impulse is generated and transmitted to the rest of the heart.
Splitting of the P wave, when two peaks are formed, indicates an enlargement of the left atrium. Often bifurcation develops with pathologies of the bicuspid valve. A double-humped P wave becomes an indication for additional cardiac examinations.
The PQ interval shows how the impulse passes to the ventricles through the atrioventricular node. The norm for this section is a horizontal line, since there are no delays due to good conductivity.
The Q wave is normally narrow, its width is no more than 0.04 s. in all leads, and the amplitude is less than a quarter of the R wave. If the Q wave is too deep, this is one of the possible signs of a heart attack, but the indicator itself is assessed only in conjunction with others.
The R wave is ventricular, so it is the highest. The walls of the organ in this zone are the densest. As a result, the electric wave travels the longest. Sometimes it is preceded by a small negative Q wave.
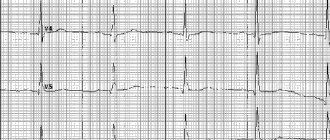
During normal heart function, the highest R wave is recorded in the left precordial leads (V5 and 6). However, it should not exceed 2.6 mV. A tooth that is too high is a sign of left ventricular hypertrophy. This condition requires in-depth diagnostics to determine the causes of the increase (ischemic heart disease, arterial hypertension, heart valve defects, cardiomyopathies). If the R wave decreases sharply from V5 to V6, this may be a sign of MI.
After this reduction, the recovery phase begins. On the ECG this is illustrated as the formation of a negative S wave. After a small T wave comes the ST segment, which normally should be represented by a straight line. The Tckb line remains straight, there are no bent areas on it, the condition is considered normal and indicates that the myocardium is completely ready for the next RR cycle - from contraction to contraction.
ECG contour analysis
A special feature of electrocardiography using the Medscanner BIORS workstation and the Medscanner Wellness software is the possibility of contour analysis of the ECG. This module is designed to find special points on the ECG graph that are diagnostically important, as well as to calculate the parameters of the cardiogram. Using the data obtained, one can judge about disturbances in the functioning of the heart.
The type of ECG of a healthy person depends on his physique, degree of fitness and other factors, but the sequence and position of certain teeth and segments are normally always the same. To evaluate the ECG, the wave height, displacement and duration of the segments are compared with normal values.
To successfully work with the contour analysis module, you must understand the basic principles of the structure of a cardiac signal. A standard ECG graph consists of many repeating, similar segments called cardiac intervals. In turn, each cardiac interval consists of a set of peaks and troughs (teeth), which reflect the work of the heart over a certain period.
ECG indicators
The ECG graph distinguishes between segments, waves and intervals. A segment is a straight line segment (isoline) between two adjacent teeth. The teeth are designated by the Latin letters P, Q, R, S, T - in the order of their appearance from left to right. They can be negative (Q or S; T or P waves can also be negative), i.e. below the isoline, or positive (T, P, R,) - above the isoline. The interval consists of a tooth (a complex of teeth) and a segment. Thus, interval = tooth + segment. The PQ and ST segments are of greatest importance for diagnosis, and the most important intervals are PQ and QT.
P wave
The P wave is the contraction of the atria. It registers first; This is a small, flat, round deflection that precedes a jagged QRS complex. The condition of the atria is best seen in leads V1 and V2, since the chest leads, unlike the standard ones, are located close to these parts of the heart. The initial part of the P wave corresponds to the excitation of the right atrium, the middle part corresponds to the end of this process and the beginning of excitation of the left atrium, the final part is generated by the left atrium.
Normally, in leads I, II, aVF, V2–V6, the P wave is always positive. In leads III, aVL, V1, the P wave can be positive or biphasic (part of the wave is positive, part is negative). In lead aVR, the P wave is always negative.
The normal duration of the P wave does not exceed 0.1 s, and its amplitude (height) is 1.5–2.5 mm or up to 0.25 mV (with standard calibration, 1 mV corresponds to 10 mm). Usually, when these parameters of the P wave deviate from the norm, we are talking about atrial hypertrophy.
The P wave may be jagged at the apex, but the distance between the teeth should not exceed 0.02 s. The excitation time of the right atrium is measured from the beginning of the P wave to its first apex (no more than 0.04 s). The time of excitation of the left atrium is from the beginning of the P wave to its second apex or to the highest point (no more than 0.06 s).
With severe damage to the atrial muscles, this tooth usually decreases, lengthens and splits. With the so-called atrial fibrillation, when the atria contract frequently and chaotically, instead of the P wave, random fluctuations of the isoline are visible.
PQ interval
The PQ interval is the distance (time interval) from the beginning of the P wave to the beginning of the Q wave (or the R wave, if there is no Q wave - then we are talking about the PR interval). This interval corresponds to the time of passage of excitation through the atria and atrioventricular node to the ventricular myocardium. The PQ (PR) interval depends on age, body weight, and heart rate. It lengthens with AV block and shortens with WPW syndrome.
Normally, the PQ interval is 0.12-0.18 (up to 0.2) seconds (6-9 cells). With age, the PQ interval lengthens.
The ratio of the duration of the P wave to the duration of the PQ segment is called the Macruse index . Normally, the Makruse index is 1.1-1.6. This index is used in the diagnosis of atrial hypertrophy.
QRS complex
The QRS complex is a ventricular complex that is recorded during the excitation of the ventricles of the heart. This is the largest complex on the ECG. It has several pointed teeth - both positive (directed upward) and negative (directed downward).
Point N is the transition from the isoline to the Q wave (Beginning of the QRS complex). Point J is the transition of the S wave to the ST segment (end of the QRS complex).
The width of the QRS complex indicates the duration of excitation in the ventricles and is normally 0.06-0.08 (up to 0.1) seconds. The width of the QRS complex decreases slightly as the heart rate increases, and vice versa. The shape of the complex can change with extraordinary contraction (extrasystole) and other conduction disturbances. Widening of the QRS complex is observed, for example, with bundle branch blocks.
Q wave
The Q wave (the initial wave of the QRS complex) is recorded during excitation of the left half of the interventricular septum. It must be present in chest leads V4, V5, V6. The Q wave should not be recorded in chest leads V1, V2, V3 (otherwise it indicates heart damage). Normally, the width of the Q wave should not exceed 0.03 s. The amplitude of the Q wave in each lead should be less than 1/4 of the amplitude of the next R wave in the same lead and not exceed 0.2 mV - with the exception of standard lead III. A normal Q wave should not be jagged.
R wave
The R wave (the main ECG wave) reflects the excitation of the ventricles of the heart. The amplitude of the R wave in standard and enhanced limb leads depends on the location of the electrical axis of the heart.
This wave, like Q, can be recorded in all standard and enhanced limb leads. From V1 to V4 its amplitude increases: RV4>RV3>RV2>RV1 (in this case, the RV1 wave may be absent), and then decreases in V5 and V6. In standard and enhanced leads in adults, the R amplitude in each of these leads should not exceed 2 mV (in lead I - 1.5 mV). In any of the chest leads, the amplitude of the R wave should not exceed 2.5 mV.
S wave
The S wave (non-permanent wave) reflects the final excitation of the base of the left ventricle of the heart. It is the deepest negative wave on the ECG. Gradually decreases from V1 to V6, may be absent normally in leads V5, V6. The S wave can have different amplitudes, but in leads I, II, aVF should not exceed 0.5 mV.
ST segment
The ST segment is very important for identifying cardiac damage. It is analyzed especially carefully in case of IHD (coronary heart disease), since it reflects the lack of oxygen (ischemia) in the myocardium. The ST segment is measured from the J point to the beginning of the T wave. On the ECG, the J point (from the word junction) can be determined by the change in the slope of the vertical curve of the end of the QRS complex and its transition to a horizontal position - the initial part of the ST segment.
Elevation (excess above the isoline) of the segment is normal:
In the limb leads - up to 0.1 mV, V1-V2 - up to 0.3 mV, in V5-V6 - up to 0.2 mV.
Depression (decreased below the isoline) of the ST segment is normal:
In limb leads - up to 0.05 mV.
The ST segment displacement is estimated using the J+60 or 80 ms rule (depending on the pulse rate). A ST segment deviation lasting 0.06–0.08 s, starting from the J point, is considered diagnostically significant.
T wave
The T wave reflects the process of repolarization (restoration of the original resting potential or resting phase) of the ventricular myocardium. It begins, as a rule, on the isoline, where the ST segment passes into it. The T wave is normally not serrated, its anterior part is flatter. Normally, the T wave is always positive in I, II, aVF, V2-V6, with TI > TIII, and TV6 > TV1. In aVR the T wave is always negative. The amplitude of the T wave (no standards have been developed) in standard and enhanced leads is usually 0.3–0.6 mV (up to 0.8), should be no less than 1/8 and no more than 2/3 of the amplitude of the previous R wave. Duration of the wave T ranges from 0.16 to 0.24 s and does not have much diagnostic value.
QT interval
The QT interval is called electrical ventricular systole, because at this time all parts of the ventricles of the heart are excited. This is the time from the beginning of the QRT complex to the end of the T wave. Its duration depends on gender, age, and heart rate. Normally, the QT interval is no more than 50% of the previous RR interval. Using Bazett's formula, you can determine whether the QT interval is normal or pathological in a particular case (the QT interval is considered pathological if it exceeds a value of 0.42):
QTb= QT (measured by ECG) / √(RR) (interval measured by ECG between two adjacent R waves)
A possible reason for prolongation of the QT interval is hypokalemia (hypocalcemia), while shortening is due to hyperkalemia (hypercalcemia).
T-P interval
This is the interval from the end of the T wave to the beginning of the P wave. It corresponds to the period of relaxation of the heart (straight line on the ECG).
Electrical axis of the heart
Standard leads of cardiac electrical impulses from the surface of the body record the difference in biopotentials between two limbs. The first standard is the potential difference between the left and right hands. The second standard is between the left leg and right hand. The third standard is between the left leg and left arm (negative electrode). These three leads form an equilateral triangle (called Einthoven's triangle) with the vertices on the limbs on which the electrodes are installed. In its middle is the electrical center of the heart, which is equidistant from all leads.
The electrical axis of the heart (EOS) is the projection of the resulting vector of excitation of the ventricles in the frontal plane. The direction of EOS shows the total magnitude of bioelectrical changes occurring in the heart muscle with each contraction. The position of the axis serves only as an additional indicator in diagnosing a particular disease.
The direction of the EOS is expressed in degrees of angle alpha. The alpha angle is formed by the EOS and a horizontal line drawn through the conditional electrical center of the heart, i.e. axis of lead I shifted to the center of Einthoven’s triangle.
In healthy people, depending on their body type, the alpha angle ranges from 0° to +90°. There are three options for the constitutionally determined provision of EOS:
- normal - alpha angle from +30° to +70°;
- horizontal - alpha angle from 0° to +30° (often with a hypersthenic body type);
- vertical - alpha angle from +70° to +90° (occurs with asthenic body type).
Normally, the electrical axis of the heart in persons over 40 years of age is located at an angle from –30 to +90, in persons under 40 years of age - from 0 to +105. A condition in which the electrical axis of the heart is deviated is not a diagnosis in itself. However, such changes in the electrocardiogram may indicate various disturbances in the functioning of the heart. Most often, deviation of the electrical axis of the heart is associated with ventricular hypertrophy, however, to clarify the nature of the pathology, it is necessary to analyze other parameters. For example, deviation of the EOS to the left may indicate hypertrophy or overload of the left ventricular myocardium. Deviation of the EOS to the right may indicate hypertrophy or overload of the right ventricle. This condition is a sign of a long-standing chronic process and, as a rule, does not require emergency help from a cardiologist. However, the danger is posed by changes in the electrical axis due to His bundle block. This situation requires urgent intervention by a cardiologist and treatment in a specialized hospital.
Heart rate analysis
Rhythm regularity is assessed by RR intervals. If the teeth are equally spaced from each other, the rhythm is called regular or regular. The spread of the duration of individual RR intervals is allowed no more than ± 10% of their average duration. If the rhythm is sinus, it is usually regular.
Sinus rhythm
This is a normal rhythm, and all other rhythms are pathological (i.e., indicate disturbances in the functioning of the heart). The source of excitation is located in the sinoatrial node . Signs on the ECG:
- in standard lead II, the P waves are always positive and are located before each QRS complex,
- P waves in the same lead have the same shape at all times.
P wave in sinus rhythm
Atrial rhythm
If the source of excitation is located in the lower parts of the atria, then the excitation wave propagates to the atria from bottom to top (retrograde), therefore:
- in leads II and III the P waves are negative,
- There are P waves before each QRS complex.
The atrial rhythm is pathological. It is characterized by the fact that the source of excitation is located in the lower parts of the atria, and the excitation wave propagates to the atria from bottom to top (retrograde), therefore, in leads II and III, the P waves are negative.
P wave in atrial rhythm
Rhythm from AV connection
If the pacemaker is located in the atrioventricular ( atrioventricular ) node, then the ventricles are excited as usual (from top to bottom), and the atria are excited retrogradely (i.e. from bottom to top). At the same time, on the ECG:
- P waves may be absent because they are superimposed on normal QRS complexes,
- P waves can be negative, located after the QRS complex.
Rhythm from the AV junction, superimposition of the P wave on the QRS complex.
Rhythm from the AV junction, the P wave is located after the QRS complex.
Heart rate with a rhythm from the AV junction is less than sinus rhythm and is approximately 40-60 beats per minute.
Ventricular (idioventricular) rhythm
In this case, the source of rhythm is the ventricular conduction system. Excitation spreads through the ventricles in the wrong way and is therefore slower.
Features of idioventricular rhythm:
- QRS complexes are widened and distorted. Normally, the duration of the QRS complex is 0.06–0.10 s, and with this rhythm the QRS duration exceeds 0.12 s.
- the relationship between QRS complexes and P waves is not fixed because the AV junction does not release impulses from the ventricles, and the atria can be excited from the sinus node as normal.
- Heart rate less than 40 beats per minute.
Idioventricular rhythm. The P wave is not associated with the QRS complex.
Conducting contour analysis
To facilitate analysis, it is advisable to enable the “Smoothing” and “50 Hz Filter” parameters in the settings when recording. It is enough to record using 3 leads.
The accuracy of the analysis largely depends on the selected ECG section, so you should choose the cardiac interval that is free of interference and artifacts.
The program automatically determines measurement control points, however, the choice of program may be incorrect due to the complexity of calculations and the vagueness of the ECG form.
Therefore, you should adjust the position of the markers (position of the teeth), characteristic diagnostic points on the curve, by moving them with the mouse.
The accuracy of diagnosis greatly depends on how correctly the markers are placed. It is also worth keeping in mind that contour analysis takes into account only the basic characteristics of the ECG, and therefore cannot be the basis for making a clinical diagnosis. If there is any suspicion of a disease of the cardiovascular system, the ECG must be interpreted by a cardiologist.
Possible errors in research
It is possible to obtain unreliable data from an electrocardiogram if the following factors influence the cardiograph when recording signals:
- alternating current frequency fluctuations,
- displacement of the electrodes due to their loose application,
- muscle tremors in the patient's body.
All these points affect the obtaining of reliable data when conducting electrocardiography. If the ECG shows that these factors have taken place, the study is repeated.
When an experienced cardiologist interprets a cardiogram, a lot of valuable information can be obtained. In order not to trigger the pathology, it is important to consult a doctor when the first painful symptoms occur. This way you can save your health and life!
( 1 ratings, average: 5.00 out of 5)
What are the types of false interference on a cardiogram that are not associated with heart pathologies?
Three types of interference can be seen on the electrocardiogram:
- Inductive currents are oscillations with a frequency of 50 Hz (alternating current frequency).
- “Floating” isoline is a displacement of the isoline up and down due to loose application of the electrodes to the patient’s skin.
- Muscle tremors - frequent irregular asymmetrical fluctuations are visible on the ECG.
In conclusion, we can say that ECG is an informative and accessible method for identifying heart pathologies. It covers a large number of characteristics, which helps in making the correct diagnosis.
An in-depth study of all aspects of deciphering a cardiogram will help the doctor in quickly and timely identifying diseases and choosing the right treatment tactics.
Author of the article:
Elena Demidova
about the author
Did you like the article?
Let us know about it -
rate
Standard electrocardiogram
Description of the study
1. Standard ECG is a recording of electrical potentials in 12 leads:
1) leads from the limbs - electrodes are placed just above the hand, on the inner surface of the right (red) and left (yellow) forearms, and also slightly above the outer ankle on the left (green) and right (black - grounding) shin;
a) two-pole (standard) - I, II, III;
b) single-pole (reinforced) - aVL, aVR, aVF;
2) unipolar chest leads - V1–V6; location of electrodes on the chest →Fig. 25.1-1; leads Vr3 and Vr4 should be recorded routinely if inferior wall infarction is diagnosed (a likely criterion for concomitant right ventricular infarction is ST segment elevation at the J point in leads Vr3 and Vr4 ≥0.5 mm).
Figure 25.1-1.
Placement of ECG electrodes
2. Scheme of normal ECG recording →Fig. 25.1-2:
1) deviations up or down from the isoelectric line - waves P, Q, R, S, T, U; Q+R+S waves = QRS complex (without R = QS complex);
2) the horizontal line between the U and P waves or between the T and P waves, if the U waves are not detected, is an isoelectric line (isoline);
3) fragments of the line between the P wave and the QRS complex, as well as between the QRS complex and the T wave - these are the PQ and ST segments;
4) fragments of the curve, consisting of a segment and an adjacent tooth, are called PQ and QT intervals.
3. The ECG is recorded on a millimeter grid, which allows measurements of heart rate, duration and amplitude of individual morphological elements of the recording.
1) with a standard speed of movement of the electrographic tape of 25 mm/s, the time interval between thin vertical grid lines (small cell) is 0.04 s, and between thick lines (large cell) - 0.2 s (Fig. 25.1-3); at a movement speed of 50 mm/s - 0.02 s and 0.1 s;
2) The standard deviation of the isoelectric line (reference millivolt) is 1 cm = 1 mV, if the value of the reference millivolt is greater or less than 1 cm, then the wave amplitude measurements must be corrected according to the formula: corrected wave amplitude (in mm) = wave amplitude ( in mm) × 10 mm / amplitude of reference millivolt (in mm).
Figure 25.1-3.
Using a millimeter grid to determine the duration time (at a standard recording speed of 25 mm/s) and amplitude of individual morphological elements of the electrocardiogram
Heart rate assessment
1. Check the ECG recording speed.
2. Determine your heart rate using a special ruler; in the absence of a ruler:
1) if the rhythm is regular → it is necessary to calculate the duration of the interval between two adjacent R waves (RR interval) and divide 60 s by the result obtained, or count the number of large cells located in the RR interval - if the speed of the tape is 25 mm/s, then 1 cell = 300/min, 2 cells = 150/min, 3 cells = 100/min, 4 cells = 75/min, 5 cells = 60/min, 6 cells = 50/min;
2) if the rhythm is irregular → it is necessary to calculate how many QRS complexes are in a 6-second recording segment (at a tape speed of 25 mm/s this is 15 cm) and multiply by 10.
3. Assess the regularity of your heart rhythm.
4. Determine the origin of the rhythm:
1) is sinus rhythm the main one, if not, which one?
2) are QRS complexes of non-sinus origin observed, if so, what is their source of origin (ventricular or supraventricular) and are they premature?
5. Assess atrioventricular conduction - it is necessary to measure the PQ interval, check whether there are P waves (sinus? non-sinus?) without subsequent QRS complexes.
Morphological analysis of ECG
1. Electrical axis of the heart (EOS): usually determined approximately, based on a visual assessment of the direction of the QRS complexes in the limb leads →Fig. 25.1-4
1) in I and III, positive - normal position of the EOS (from +30° to +90°);
2) in I and III they are directed towards each other - deviation of the heart axis to the right (pravogram)
a) in lead aVF positive - from +90° to ±180°;
b) in lead aVF negative - ±180° to -90° (undefined EOS; according to the recommendations of the American Heart Association (AHA), the American Society of Cardiology (ACC) and the Association for Rhythm Disorders (HRS) - axis deviation up and to the right);
3) in I and III they are directed away from each other (diverging)
a) in II, positive – normal position of the EOS (from +30° to –30°);
b) in II negative - deviation of the heart axis to the left (levogram; from –30° to –90°).
2. P wave: represents atrial depolarization:
1) positive in I and II - indicate the correct direction of atrial depolarization, are an electrocardiographic sign of sinus rhythm;
2) negative in II and III - indicate the opposite direction of atrial depolarization (excitations and rhythms emanating from the lower part of the right or left atria, AV node or ventricles);
3) dilated ≥0.12 s, associated mainly with their notching or splitting - may be associated with an increase (hypertrophy, dilatation) of the left atrium or with intra-atrial conduction disorders.
An additional, more characteristic sign of left atrium enlargement is biphasic, positive-negative P waves in V1 (negative phase ≥0.04 s and ≥1 mm); widened and split P waves in the limb leads, as well as pathological biphasic ones in lead V1 are called P mitral.
4) high (>2.5 mm in the limb leads, >3 mm in the chest leads) - increased activation of the sympathetic nervous system or enlargement of the right atrium (P pulmonale).
Tall and widened P waves in the limb leads and biphasic with a deep and wide negative phase in lead V1 are observed in patients with hypertrophy of both atria due to congenital heart defects.
Such teeth are called P cardiale.
5) invisible - hidden behind the T wave during accelerated sinus rhythm or layered on the QRS complexes (simultaneous depolarization of the atria and ventricles can occur with rhythms emanating from the ventricles or AV node).
The actual absence of P waves occurs in the case of slow pacemaker activity of the sinus node or in the case of sinoatrial block.
The absence of P waves despite normal sinus node function may be due to a delay in atrial electrical activity (the condition for diagnosing this rare pathology on the ECG is the simultaneous detection of absence of atrial mechanical activity or A waves on the atrial electrocardiogram and lack of response to atrial stimulation).
Source: https://empendium.com/ru/chapter/B33.V.25.1.1.