Home » Heart diseases or cardiac diseases » Electrical alternans of the heart
May 11, 2020 No comments
Electrical alternans is a broad concept that describes the change in heart rate in direction, amplitude and duration of any component of the ECG waveform (i.e. P, PR, QRS, RR, ST, T, U). The condition was first described by Hearing in 1909 and further detailed by Sir Thomas Lewis in 1910 as occurring "either when the heart muscle is in a normal state but the heart rate is very fast, or when there is serious heart disease and the heart rhythm is normal."
Kalter and Schwartz first identified electrical alternans on the ECG in 1948. Electrical alternans should be distinguished from mechanical alternans (eg, alternating pulse), although both can coexist.
Pathophysiology
The pathophysiological mechanisms that lead to electrical alternans can be divided into 3 categories: (1) repolarization disturbances (ST, T, U complexes), (2) conduction and refractoriness disturbances (P, PR, QRS complexes) and (3) cardiac alternans movements. The actual electrical alternans is repolarization or conduction abnormality of the Purkinje fibers or myocardium.
The cellular mechanism behind the electrical alternans is believed to be due to abnormal calcium levels, or impaired release, impaired reuptake of calcium by the sarcoplasmic reticulum. Electrical alternans associated with heart rate are rare because the heart oscillates against the chest wall and electrodes at a period twice the heart rate.
Main characteristics and changes of the ECG
P wave
The following questions are often associated with P-wave analysis:
- Are there P-waves?
- If so, is every P wave accompanied by a QRS complex?
- Do P waves look normal? (duration of check, direction and form)
- If not, is there any atrial activity, such as sawtooth baseline → flutter waves/chaotic baseline → fibrillating waves/flat line → no atrial activity at all?
The nuance of deciphering the ECG: If P-waves are absent and there is an irregular rhythm, this can provoke atrial fibrillation.
PR interval
The PR interval should be between 120 and 200 ms (3-5 small squares)
The long PR interval is more than 0.2 seconds. Its presence may be associated with atrioventricular delay (AV block).
First degree heart block
First degree heart block involves a fixed long PR interval (more than 200 ms).
Second degree heart block (Mobitz type 1)
If the PR interval slowly increases, then a resettable QRS complex occurs, which corresponds to Mobitz type 1 AV block.
Second degree heart block (Mobitz type 2)
If the PR interval is fixed, but there is a decrease in the isoline, then they talk about AV blockade type Mobitz 2, and the frequency of incident beats should be specified, for example, 2:1, 3:1, 4:1.
Third degree heart block (complete heart block)
If P waves and QRS complexes are completely uncoupled, third degree AV block occurs.
Tips for remembering types of heart block
1. To remember the degrees of AV block presented, it is useful to visually perceive the anatomical location of the block in the conduction system of the heart: 1.1 First degree AV block occurs between the sinoatrial node (SA node) and the AV node (that is, inside the atrium). 1.2 Second degree AV block (Mobitz I) is determined at the level of the AV node. This is the only segment of the conduction system of the heart that has the ability to transfer incoming impulses from a higher speed to a lower one. Mobitz II - occurs after the AV node in the His bundle or Purkinje fibers. 1.3 The third level of AV block occurs lower in relation to the AV node, which leads to complete blocking of impulse conduction.
Shortened PR interval
If the PR interval is short, it means one of two things:
- The P wave comes from a site closer to the AV node, so conduction takes less time (the SA node is not in a fixed location, and some atria are smaller than others!).
- The atrial impulse travels to the ventricle more quickly instead of passing slowly through the atrium wall. This may be an auxiliary pathway associated with the delta wave. A similar ECG is often observed in patients with Wolff-Parkinson-White syndrome.
QRS complex
There are several characteristics of the QRS complex that need to be assessed:
- Width.
- Height.
- Morphology.
QRS complex width
The width can be described as narrow (NARROW, less than 0.12 seconds) or wide (BROAD, more than 0.12 seconds).
A narrow QRS complex occurs when the impulse is conducted along the His bundle and Purkinje fibers into the ventricles. This leads to well-organized synchronous depolarization of the ventricles.
A wide QRS complex occurs if there is an abnormal sequence of depolarization - for example, ventricular ectopy, when the impulse slowly spreads across the myocardium from the source of excitation in the ventricle. With atrial ectopia, a narrow QRS complex is most often detected because the impulse travels through the normal cardiac conduction system. Similarly, branch blockade results in a wide QRS because the impulse quickly enters one ventricle along the intrinsic conduction system and then slowly travels through the myocardium to the other ventricle.
Height of the QRS complex
Described as small (SMALL) and tall (TALL).
Small ventricular complexes are defined as a height below 5 mm in the main leads or less than 10 mm in the precordial leads.
High QRS complexes most often indicate ventricular hypertrophy (although changes may be related to the person's constitution, such as pain and growth). There are many algorithms for measuring ventricular hypertrophy, mainly left ventricular hypertrophy, among which the Sokolov-Lyon index or Cornell index is most often used.
Morphology of the QRS complex
During interpretation of the ECG, individual elements of the QRS complex are assessed.
- Delta wave
The appearance of a delta wave is a sign that the ventricles are being activated earlier than usual. Early activation followed by slow propagation of the impulse throughout the myocardium causes a slurred burst of the QRS complex. At the same time, the presence of a delta wave does not allow us to speak unambiguously about Wolff-Parkinson-White syndrome. In such cases, tachyarrhythmias in combination with delta waves must be determined for confirmation.
- Q-wave
Isolated Q waves can be detected in the normal state. A pathological Q wave is more than 25% the size of the R wave that follows it, or more than 2 mm in height and more than 40 ms in width. Sometimes it is enough to see Q waves on various ECG leads to obtain evidence of a previous myocardial infarction.
Q waves (V2-V4), with T wave inversion, may indicate previous anterior myocardial infarction.
- R- and S-waves
The R wave is characterized by a progression in the chest leads (starting small in V1 and ending large in V6). The transition from wave S>R to R>S should occur in leads V3 or V4. Poor progression (ie, S>R to leading V5 and V6) may be a sign of previous MI. It is also sometimes detected in very tall people due to the location.
- J point segment
The J-point is when the S-wave connects the ST segment. This point can be raised, causing the ST segment that follows it to also rise, and is then referred to as a “high rise.”
High rise (or benign early repolarization) is a normal ECG pattern that causes many different negative interpretations because it is primarily looking at ST segment height.
Important Features:
- Benign early repolarization is observed mainly before the age of 50 years (in people over 50 years of age, ischemia is more common, which should be suspected first).
- Typically, the J-point is associated with ST elevation in many leads, making ischemia less likely.
- The T waves also rise (unlike STEMI, which is myocardial infarction, where the T wave remains unchanged and the ST segment rises).
- Changes associated with benign repolarization do not change much over time, unlike myocardial infarction, since during STEMI changes will be observed after a week or two or more.
ST segment
The ST segment is the part of the ECG located between the end of the S wave and the beginning of the T wave. In a healthy person, this segment is comparable to the isoelectric line, which is neither increased nor decreased. ST segment abnormalities are examined to rule out pathology.
ST segment elevation
ST height is considered significant when it is greater than 1 mm (1 small square) in two or more adjacent standard leads or greater than 2 mm in two or more precordial leads. This is most often associated with acute macrofocal myocardial infarction.
ST segment depression
ST segment depression is said to occur when there is a decrease relative to the isoline by more than 0.5 mm in two or more adjacent leads, which indicates myocardial ischemia.
T wave
The formation of T waves is associated with ventricular repolarization.
Tall T waves
T waves are considered tall if they:
- More than 5 mm in standard leads.
- More than 10 mm in the precordial leads (the same criteria as in the case of “small” QRS complexes).
Tall T waves may be associated with:
- Hyperkalemia.
- Acute myocardial infarction.
Inverted T waves
T waves are usually inverted in V1, which is the first chest lead, and inversion in the standard lead III is also normal.
Inverted T waves in other leads are nonspecific signs of a wide range of diseases:
- Ischemia.
- Blockade of Purkinje fibers.
- Pulmonary embolism.
- Left ventricular hypertrophy (in the lateral leads).
- Hypertrophic cardiomyopathy (widespread).
- Generalized pathological process.
When interpreting the ECG, a comment may be added regarding the distribution of T-wave inversion, for example. front / side / rear.
Biphasic T waves
Biphasic T waves have two peaks and may indicate ischemia and hypokalemia.
Flat T teeth
Another nonspecific sign that may indicate ischemia or electrolyte imbalance.
U wave
U waves have a deviation greater than 0.5 mm after T waves are best identified in precordial leads V2 or V3.
The teeth become larger when the rhythm slows down (bradycardia). Classically, U waves are detected during various electrolyte imbalances, hypothermia, or antiarrhythmic therapy with drugs such as digoxin, procainamide, or amiodarone.
Electrical alternans of ventricular complexes
Repolarization alternans can be further subclassified as T-wave alternans and ST-segment alternans. T-wave alternans are associated with rapid changes in heart rate or prolongation of the QT interval. A long QT interval is the cause of polymorphic ventricular tachycardia (an unusual type of polymorphic VT); therefore, T-wave alternans are a possible precursor to polymorphic VT.
Long QT syndrome, electrolyte imbalances (eg, hypocalcemia, hypokalemia, hypomagnesemia), hypertrophic cardiomyopathy, alcoholic cardiomyopathy, congestive heart failure, and acute pulmonary embolism have been reported to occur with T-wave alternans. T-wave alternans are also observed after cardiac resuscitation. Most importantly, the presence of T-wave alternans can be used as an indicator of ventricular tachyarrhythmic events such as sudden cardiac death, sustained ventricular tachycardia, ventricular fibrillation, and cardiac arrest.
ST segment alternans represents alternating levels of the ST segment, usually in the presence of myocardial ischemia. Vasospastic angina, acute myocardial infarction, nonvascular angina have been reported during exercise, during percutaneous transluminal coronary angioplasty, and after subarachnoid hemorrhage. ST segment alternans during acute ischemia are associated with the occurrence of ventricular arrhythmias, including ventricular tachycardia and ventricular fibrillation.
Conduction disorders are alternating impulse propagation along any of the anatomical structures involved in the transmission of electrical impulses. Conduction alternans can be observed in the setting of myocardial ischemia, atrial fibrillation, Wolff-Parkinson-White syndrome, rheumatic heart disease, acute pulmonary embolism, myocardial contusion and left ventricular dysfunction.
They may appear on the ECG as an alternation of the P wave, QRS complex, PR interval, RR interval, or any combination thereof. QRS alternans in narrow complex tachycardia are an indicator of orthodromic atrioventricular reentrant tachycardia.
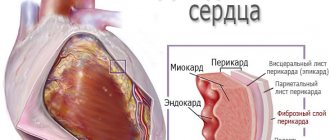
Electrical alternans associated with cardiac movement are caused by alternating positions of the heart relative to the recording electrodes. The most common underlying condition is an enlarged pericardial sac; however, not all pericardial effusions result in electrical alternans.
The presence of pericardial disease and global electrical alternans (P, QRS, and T waves) often suggests cardiac tamponade, but complete electrical alternans are observed in only 5-10% of patients who have cardiac tamponade. Cardiac motion in patients with hypertrophic cardiomyopathy can also lead to electrical alternations of this type.
ECG 12. Rotation of the heart with its apex forward
10 mm/mV 50 mm/s
Heart rate = 68/min. Email axis 42° is normal. P−Q
= 0.180 s.
P
= 0.105 s.
QRS
= 0.089 s.
Q−T
= 0.374 s. Sinus rhythm. The voltage is satisfactory. Normal position of the electrical axis of the heart. Rotate the heart with the apex forward.
ECG 13. Rotation of the heart with its apex backwards
10 mm/mV 50 mm/s
Heart rate = 82/min. Email S axis
I-
S
II-
S
III.
P−Q
= 0.172 s.
P
= 0.108 s.
QRS
= 0.107 s.
Q−T
= 0.342 s. Sinus rhythm. The voltage is satisfactory. Turning the heart backwards. Incomplete blockade of the right bundle branch. Nonspecific intraventricular conduction disorders.
HYPERTROPHY AND ENLARGEMENT OF THE HEART CHAMBERS
Left atrial hypertrophy
— duration of wave P
increased (0.12 s or more), the
P
is split in leads I, II and aVL;
— the final (negative) component of the P
in lead V1 - deepened and widened (exceeds 0.04 s).
Auxiliary criterion - wave axis P
in the frontal plane it is deviated to the left by +15° or less.
Right atrial hypertrophy
— wave amplitude P
- 2.5 mm or more in leads II, III and aVF, the duration of the
P
is not changed;
— initial positive component of wave P
in lead V1 is 1.5 mm or more.
An auxiliary criterion is the location of the wave axis P
in the frontal plane at an angle of +75° or more.
Left ventricular hypertrophy
(amplitude signs) in combination with ST
−
T
or without (criteria apply to patients over 40 years of age):
— Sokolov-Lyon index more than 35 mm (sum of amplitudes of the S
in lead V1 and the
R
in leads V5 or V6);
or the amplitude of the R
in lead aVL is greater than 11 mm; or the sum of the amplitudes of the
R
in lead I and the
S
in lead III is greater than 25 mm; or the Lewis index exceeds 17 mm: (the amplitude of the
R
in lead I minus the amplitude of the
S
in lead 1 ) + (amplitude of the
S
in lead III minus the amplitude of the
R
in lead III).
Additional signs:
— phenomena of left ventricular overload;
- increase in the time it takes for the R
peak (time of internal deviation) up to 0.05 s or more in the left precordial leads;
- changes in the left atrium.
Right ventricular hypertrophy
— QRS
to the right (in the absence of other reasons);
— amplitude of the R
greater than the amplitude of the
S
in lead V1;
— amplitude of the R
in lead V1 greater than or equal to 7 mm;
- ventricular complex in the form of qR
in lead V1;
- ratio R
:
S
in leads V5 or V6 is less than or equal to 1.
Additional signs:
— increase in the time it takes for the R
(time of internal deviation) in lead V1 up to or above 0.035 s;
— depression of the S
T
wave inversion in the right precordial leads;
— amplitude of the S
in lead V1 less than 2 mm.
Diagnostics
Direct laboratory tests to identify the primary underlying etiology of electrical alternans. Appropriate laboratory tests are prescribed, which include a blood test for enzymes characteristic of myocardial ischemia and infarction, as well as tests of serum calcium, potassium and magnesium levels if an electrolyte imbalance is suspected. If large pericardial effusion is detected, laboratory tests to look for malignancy may be required.
Chest X-ray
A chest x-ray may reveal an enlarged heart, as well as the possibility of cardiomyopathy or a large pericardial effusion.
The presence of Westermarck's sign or Hampton's hump may indicate pulmonary embolism as the cause of electrical alternans.
Echocardiography
Echocardiography is indicated for patients with complete electrical alterations (P, QRS, and T waves) to diagnose pericardial effusion.
Echocardiography is also necessary to diagnose hypertrophic cardiomyopathy, alcoholic cardiomyopathy, or congestive heart failure.
Electrocardiogram when the heart rotates around the longitudinal axis
June 8, 2009
When the heart rotates clockwise around its longitudinal axis (as viewed from the apex), the right ventricle moves forward and upward, and the left ventricle moves backward and downward.
This position is a variant of the vertical position of the heart axis.
In this case, a deep Q wave appears on the ECG in lead III, and occasionally in lead aVF, which can simulate signs of focal changes in the posterior phrenic region of the left ventricle.
At the same time, a pronounced S wave is detected in leads I and aVL (the so-called QIII SI syndrome). There is no q wave in leads I, V5 and V6. The transition zone may shift to the left. These changes also occur with acute and chronic enlargement of the right ventricle, which requires appropriate differential diagnosis.
The figure shows an ECG of a healthy 35-year-old woman with an asthenic build. There are no complaints about dysfunction of the heart and lungs. There is no history of diseases that could cause hypertrophy of the right heart. Physical and x-ray examination revealed no pathological changes in the heart and lungs.
The ECG shows the vertical position of the atrial and ventricular vectors. Â P = +75°. Â QRS = +80°. Noteworthy are the pronounced q waves along with tall R waves in leads II, III and aVF, as well as S waves in leads I and aVL.
Transition zone in V4-V5.
The indicated ECG features could provide grounds for determining hypertrophy of the right heart, but the absence of complaints, anamnesis data, and the results of clinical and X-ray examinations allowed us to exclude this assumption and consider the ECG to be a normal variant.
The rotation of the heart around the longitudinal axis counterclockwise (i.e., with the left ventricle forward and upward), as a rule, is combined with deviation of the apex to the left and is a rather rare variant of the horizontal position of the heart.
This variant is characterized by a pronounced Q wave in leads I, aVL and left chest along with pronounced S waves in leads III and aVF. Deep Q waves may mimic signs of focal changes in the lateral or anterior wall of the left ventricle.
The transition zone with this option is usually shifted to the right.
A typical example of this variant of the norm is the ECG shown in the figure of a 50-year-old patient with a diagnosis of chronic gastritis. This curve shows a pronounced Q wave in leads I and aVL and a deep S wave in lead III.
“Practical electrocardiography”, V.L. Doshchitsin
In some cases, variants of a normal ECG associated with different positions of the heart axis are mistakenly interpreted as a manifestation of one or another pathology.
In this regard, we will first consider the “positional” variants of a normal ECG.
As mentioned above, healthy people may have a normal, horizontal or vertical position of the electrical axis of the heart, which depends on body type, age and...
A normal ECG with a horizontal position of the electrical axis of the heart must be distinguished from signs of left ventricular hypertrophy. When the electrical axis of the heart is vertical, the R wave has a maximum amplitude in leads aVF, II and III; in leads aVL and I, a pronounced S wave is recorded, which is also possible in the left chest leads. ÂQRS = + 70° – +90°. Such...
Posterior rotation of the heart is accompanied by the appearance of a deep S1 wave in leads I, II and III, as well as in lead aVF. A pronounced S wave may also be observed in all chest leads with a shift of the transition zone to the left. This variant of a normal ECG requires differential diagnosis with one of the ECG variants for right ventricular hypertrophy (S-type). The picture shows...
Premature or early repolarization syndrome is a relatively rare variant of a normal ECG. The main symptom of this syndrome is ST segment elevation, which has a peculiar shape of a convex downward arc and begins from a high J point on the descending knee of the R wave or on the terminal part of the S wave. A notch at the point of transition of the QRS complex to the descending ST segment ...
Peculiar ECG changes are observed in persons with dextrocardia. They are characterized by the opposite direction of the main teeth compared to the usual one.
Thus, in lead I, negative P and T waves are detected, the main wave of the QRS complex is negative, and a QS type complex is often recorded.
Deep Q waves may be observed in the chest leads, which may give rise to erroneous diagnosis of large-focal changes...
Source: https://www.medkursor.ru/biblioteka/electrocardiography/normal/7064.html
Electrical alterations on the ECG
ECG is the main test used to detect electrical alternans. Any components of electrical signals can exhibit alternans.
Typical electrical QRS alternation. Note that the QRS voltage is low.
The ECG is the primary test by which electrical alternatives are discovered. Any or all electrical signal components may exhibit alternatives (see following images).
Supraventricular tachycardia with alternans. Note the phasic nature of the QRS morphology, especially in lead V1.
High-resolution ECG with spectral analysis can detect alternans in the microvolt amplitude range. This detailed examination is effective in diagnosing T-wave alternans as a precursor to episodes of ventricular tachyarrhythmia.
Routine ambulatory ECG monitoring of T-wave alternators using dynamic, non-spectral, modified moving average analysis may be useful for risk stratification for arrhythmias.
T-wave alternans can best be seen in lead V2. T-wave alternans can be detected using implantable cardioverter defibrillators (ICDs).
Procedures
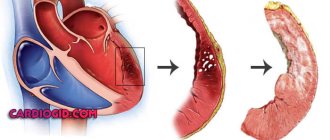
Electrical alternatives resulting from large pericardial effusion should completely dissolve after the effusion has passed. Pericardiocentesis must be performed in the setting of cardiac tamponade.
In selected cases, cardiac catheterization may be prescribed for further evaluation of patients with suspected vasospastic or nonvascular angina.
Process mechanism
Pq interval is a parameter when decoding an electrocardiogram, which allows the doctor to correctly assess the speed of transmission of the electrical impulse from the pacemaker to the atria and ventricles. This impulse is transmitted through the atrioventricular connection, which acts as a “transmitter” between the zones of the heart.
A pq interval is considered short when it is less than 0.11 seconds. The ECG norm for the pq interval is in the range of up to 0.2 s.
When the interval increases, this indicates problems in conduction within the atrioventricular junction. If it shortens, it means the impulses are passing too quickly. As a result, some forms of arrhythmias or tachycardia develop.
Clc syndrome refers to cases when changes within the heart muscle are quite pronounced. At the same time, an additional electrical conduction beam (James beam) takes place. It is through it that additional impulses are released.
Treatment
Direct appeal to the correction of the main cause of electrical alternans. For example, myocardial infarction should be treated using standard methods (eg, consider thrombolytic therapy or PTCA). Long QT syndrome can be treated by stopping the offending medications or correcting metabolic abnormalities.
Surgery
Most diseases that cause actual electrical alternans do not require surgical treatment. Pulmonary embolectomy may be required to treat severe blockages in the pulmonary arteries. Left cervicothoracic sympathetic ganglionectomy may be necessary in patients with congenital long QT syndrome who experience episodes of syncope despite medical therapy. Recurrent pericardial effusions can be treated with pericardiectomy.
Diet
No special dietary restrictions are required other than those required to treat the underlying disease (eg, salt restriction for heart failure).
No specific activity restrictions are required other than those required to treat the underlying disease (eg, avoidance of stress and strenuous exercise for patients with congenital QT syndrome, to prevent arrhythmias).
( 1 votes, average: 2.00 out of 5)
Shortening of the pq interval on the ECG - causes of development, diagnosis of pathology, possible risks
Cardiovascular diseases are a common cause of death among the population of our country.
In most cases, a tragic outcome can be prevented if the pathologies found are diagnosed and treated in a timely manner.
However, it is not easy to read the results of an electrocardiogram on your own, and it is better to have a good cardiologist do it. What does shortening of the pq interval mean on ECG results? Do you need any help?
Definition of concepts
Fortunately, most people, feeling problems with their heart, turn to doctors for advice. Various types of arrhythmias, including rapid or uneven pulse, develop due to malfunctions in the conduction system of the heart. These abnormalities can be seen on the electrocardiogram.
Deviations in the conduction system of the heart almost always affect the pq interval. In most cases, short interval syndrome develops.
Shortened pq interval syndrome refers to a decrease in the interval of impulse transmission from the atria to the ventricles through the atrioventricular junction.
The following conditions fall under this characteristic:
- Wolff-Parkinson-White syndrome,
- Clerk-Levy-Christesco syndrome (or clc syndrome).
To better understand the essence of the pathology, it is worth considering what happens inside when the ECG reflects such a picture.
Process mechanism
Pq interval is a parameter when decoding an electrocardiogram, which allows the doctor to correctly assess the speed of transmission of the electrical impulse from the pacemaker to the atria and ventricles. This impulse is transmitted through the atrioventricular connection, which acts as a “transmitter” between the zones of the heart.
A pq interval is considered short when it is less than 0.11 seconds. The ECG norm for the pq interval is in the range of up to 0.2 s.
When the interval increases, this indicates problems in conduction within the atrioventricular junction. If it shortens, it means the impulses are passing too quickly. As a result, some forms of arrhythmias or tachycardia develop.
Clc syndrome refers to cases when changes within the heart muscle are quite pronounced. At the same time, an additional electrical conduction beam (James beam) takes place. It is through it that additional impulses are released.
Differences between syndrome and phenomenon
Experts in the field of cardiology distinguish clc syndrome and phenomenon. How are these two diagnoses different?
The SLS phenomenon does not threaten the patient’s life. A person simply must periodically visit a cardiologist, carefully monitor diet and lifestyle, and avoid bad habits, stress and anxiety. Although the pq interval is shortened, the person experiences virtually no symptoms and this diagnosis does not affect his well-being.
SLS syndrome, on the contrary, can be extremely life-threatening for the patient.
The fact is that in addition to the changes reflected by the electrocardiogram, a person may exhibit a number of dangerous symptoms, such as paroxysmal tachycardia, most often supraventricular.
Important! If a patient with the syndrome is given prompt medical care correctly and in a timely manner, the attack can be stopped. In severe cases, the patient faces sudden death associated with cardiac arrest.
Reasons for the development of a shortened pq interval
The reason for the development of this pathology is a congenital predisposition. In fact, this is a form of congenital pathology. But whether it manifests itself or not largely depends on a person’s life.
The only difference between a healthy heart and a heart with the syndrome is the presence of an additional electrical conductive bundle inside the heart muscle.
It may not manifest itself in any way for many years, but sometimes the pathology is diagnosed in infancy.
In some cases, arrhythmic manifestations due to an additional bundle begin to appear during periods of active growth and adolescence.
Provoking factors
However, lifestyle influences the likelihood of developing complications. Experts cannot determine the exact reasons, however, as statistics show, there is a group of factors under the influence of which paroxysmal tachycardia occurs most often.
The following can provoke a worsening of the condition and development of symptoms:
- heavy physical activity and heavy lifting,
- frequent visits to saunas and baths,
- constant psycho-emotional stress,
- hypertonic disease,
- binge eating,
- alcoholism,
- bad habits,
- tendency to eat foods very hot,
- the effect of contrasting temperatures on the body,
- childbirth,
- coughing.
Symptoms do not always occur, but if they develop, they require diagnosis and attention from a doctor.
Symptoms of paroxysmal tachycardia
Symptoms develop periodically and are in the nature of attacks. In the intervals between them, the patient feels as usual and does not experience any abnormal sensations.
Attention! If your heart rate does not exceed 120 beats per minute, there is no cause for concern. But when it reaches 180 or more beats, it is important to constantly monitor your condition.
In the presence of provoking factors, the following symptoms may appear:
- attacks develop suddenly, for no apparent reason,
- a person feels a strong heartbeat that causes him discomfort,
- severe weakness and fatigue appear,
- sweat appears on the skin,
- limbs cool down
- the skin on the face either turns red or turns pale,
- the patient experiences a feeling of lack of oxygen, which may be accompanied by a fear of death,
- There is a burning sensation in the heart area, a feeling of constriction in the sternum.
Attention! If some of the above symptoms appear, in order to prevent the development of complications, you need to go to the hospital, or better yet, call an ambulance.
Diagnostic measures
After an in-person examination, the doctor may recommend additional examination. It is impossible to accurately determine pathology based on symptoms. Electrocardiography, cardiac ultrasound, and transesophageal EPI are performed. The doctor decides what procedures are needed.
After receiving the results of the cardiogram, the doctor will pay attention to different segments, including the pq interval. Based on the data obtained, he can make a diagnosis and prescribe treatment.
It is difficult to predict the condition of a patient with a shortened pq interval on the ECG. If there are no symptoms of paroxysmal tachycardia, the patient is healthy, and only changes are visible on the ECG, the prognosis is favorable.
The best advice for this pathology is to take care of your health and periodically undergo preventive examinations with a good cardiologist. This way, you can notice negative changes in the results of the electrocardiogram in time and take appropriate measures.
Loading…
Source: https://dlja-pohudenija.ru/serdcze/diagnostika/kakovy-prichiny-ukorocheniya-intervala-pq-na-kartine-ekg-diagnostika-i-postanovka-diagnoza