Methods for checking heart condition
There are five main methods for studying the heart - auscultation, phonocardiography, echocardiography, electrocardiography and x-ray techniques. Each of them is widely used in our area, so first of all you need to understand how they differ from each other.
- Auscultation allows you to listen to all the sounds that occur when the heart beats by applying a stethoscope to your chest.
- Phonocardiography allows you to record all heart murmurs and tones in the range of 15-1000 Hz, that is, it is an addition to the previous method.
- Echocardiography examines large vessels and the heart based on the reflection of an ultrasound signal using a special transducer containing a crystal.
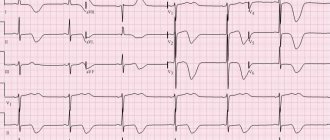
- Electrocardiography makes it possible to calculate the frequency and nature of the heart rhythms, as well as to find out the characteristics of the electrical processes that occur in it, thereby allowing timely diagnosis of cardiac arrhythmias.
- X-ray techniques accurately determine the size and shape of both the entire heart and its parts, indicate the presence of fluid in the pericardium and the state of blood circulation in the lungs, and also note the pulsation of the heart.
Why is the procedure needed?
As we have already found out, phonocardiography is an addition to auscultation, which allows you to hear even those noises and tones that arise during the work of the heart and are not audible with a stethoscope. The phonocardiograph with which this study is carried out makes it possible to capture the most inaudible sounds that are heard when the heart rhythmically pumps blood, the heart valves alternately work, and rhythmic contraction of the myocardium occurs. And in accordance with the duration of the recorded sounds, the intervals between them, the presence of changes in tones and additional clicks, one can judge the presence of certain heart pathologies.
Recording sounds
Having learned that auscultation and phonocardiography make it possible to hear various sounds that arise during the work of the heart, let's figure out what exactly they are and what characteristics they have in order to accurately understand the entire need for the procedures:
- The strength of sound is calculated in decibels and represents the sound energy transferred per 1 second per 1 cm2. It is proportional to the amplitude of sound vibrations, so the higher it is, the louder the heartbeats are.
- The frequency of sound is measured in hertz and represents the number of sound vibrations that occur in one second. A person can hear an average sound frequency in the range of 20-20,000 Hz.
- Pure heart sounds on phonocardiography are very rare and represent sound vibrations with one single sound frequency.
- Complex tones are created when a certain number of pure tones are mixed, which happens much more often.
- Noises are multiple sound vibrations that are not connected to each other by the correct ratio, so their presence most often indicates the presence of pathologies.
Basics of FKG
Auscultation provides a large amount of information about the main sounds that appear in the heart during its contraction, but it is to a certain extent subjective, because we all hear differently. In addition, using the ear it is difficult to estimate the amplitude, duration, and interval between individual sound vibrations. For such an analysis, you need a device that impartially records everything that happens in the heart and large vessels.
Cardiac phonocardiography, regardless of its information content, cannot be an independent diagnostic method like ECG or auscultation; it only complements them. It is impossible to decipher its results without detailed knowledge of auscultatory signs of cardiac activity, and for the correct application of sensors, one way or another, you will have to listen to the heart with a phonendoscope.
A little physics
Sound waves characterize vibrations of the walls of the heart, blood vessels, the movement of blood and its impacts on obstacles. The main characteristics of sound are its strength and frequency. Strength is measured in decibels and is proportional to the amplitude of the sound wave. The louder the sound the doctor hears, the greater its strength and greater amplitude will be on the FCG recording.
The frequency of a sound wave is measured in Hertz, which is the number of vibrations of sound per unit time. The human ear hears sounds in the range of 20-20,000 Hz, and everything that lies beyond these limits can only be determined by special equipment. In fact, there is no need to search for sounds that lie beyond the boundaries of our perception, since the heart produces tones in the range of 150-200 Hz, and noises do not exceed 1000 Hz in frequency, so the doctor himself can hear both of them perfectly well. However, in pathology, low-frequency vibrations may occur, which, if audible, are difficult to analyze by the ear, and the third and fourth heart sounds may go unnoticed in the mass of other sound waves, so a detailed characterization and search for such low-frequency waves in heart diseases takes on special meaning.
In cardiology, sounds produced by a beating heart are divided into tones and murmurs. The heart sound is a fairly loud and clear sound. With pathology in the heart, in addition to tones, various types of noise appear. These sounds are not related to each other and have different strengths and frequencies. Both tones and noises in most cases can be detected by auscultation, and at different listening points they will have different volumes.
A phonocardiograph consists of a microphone, analyzing and recording devices. The microphone “hears” heart sounds and noises, the device amplifies them, converts them into electrical signals and records them on paper, similar to what happens with an ECG. The phonocardiograph is equipped with filters to eliminate unnecessary noise and make recording more accurate. The procedure does not cause pain or discomfort and does not require any specific preparation.
Who is assigned to the study?
Now let's find out who is prescribed phonocardiography (PCG) and with what symptoms the patient is sent for such a study. So, this procedure is necessarily prescribed for those who suffer from any defects of the valve apparatus, congenital anomalies of the heart and rheumatism, which is accompanied by inflammation of the organ.
In addition, patients who come to a cardiologist or therapist with complaints of shortness of breath that occurs during physical activity, or pain in the chest and heart, as well as those who have previously suffered a myocardial infarction, have an increased organ size, and those , who had abnormal sounds noted during examination with a stethoscope.
How is phonocardiography performed?
What is phonocardiography, or FCG? This is a method for studying the work of the myocardium, which is based on amplification of sounds generated during the functioning of the organ, their registration and subsequent analysis of the resulting curves. It allows you to diagnose possible heart diseases.
To carry out the procedure, special devices are used, which are called phonocardiographs, their main elements are:
- microphone;
- amplifier;
- frequency filters that help eliminate extraneous sounds and make the recording clearer;
- recording device.
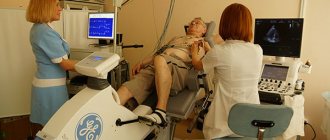
During the examination, 6 microphones are attached to the chest to better listen to the work of the organ. They convert sound vibrations into electrical impulses.
The received signals are processed using a device and recorded with an ink recorder or on photographic paper. The final result is presented in the form of curves, after studying which the doctor will be able to make a diagnosis.
During the procedure, the person is in a horizontal position; the doctor may ask him to take a deep breath, hold his breath, and turn over on his side..
In some cases, phonocardiography is performed with the use of medications that change the functioning of the heart or have a vasodilating effect, or after physical activity. The entire procedure without the use of drugs takes no more than 10 minutes, with them the duration increases to half an hour.
Usually, an ECG is performed in parallel with a PCG; this allows one to compare the recorded sounds and the electrical activity of the organ.
Advantages of FKG
Some people think that if it is possible to undergo auscultation, then cardiac phonocardiography is no longer needed. However, this is not at all true, because this procedure has a number of advantages. And the main thing is that such a study allows us to exclude all subjective factors that may arise as a result of the auscultation technique for recording sounds. Indeed, in this case, it can be affected by the doctor’s hearing, various extraneous noises, device breakdown, and with phonocardiography, all sounds are recorded by a machine, so here the result will be one hundred percent truthful and will allow you to give an accurate assessment of the strength and frequency of the sound, the duration of noises and tones, as well as intervals that occur between them. And if you conduct a FCG and an ECG at the same time, the result of the study will help the doctor see the clearest picture of the patient’s heart condition and prescribe appropriate treatment.
Disadvantages of FKG
However, everything is not so good, because the phonocardiography method has not only advantages, but also significant disadvantages. And the main one is that the phonocardiograph has a very weak sensitivity of the device compared to the human ear, which is why weak sounds that a well-hearing doctor can distinguish during auscultation will not be visible on the phonocardiogram.
In addition, from it it will be impossible to determine the nature of the noise, even subjective, which is completely unique in some cases of heart valve pathologies. And finally, in the case of displacement of the heart or dilatation and hypertrophy of its chambers, it is very difficult to find a place where the phonocardiograph microphone should be placed.
Presence of contraindications
According to cardiologists and therapists, phonocardiography is a procedure that has virtually no contraindications. In addition, this research method is completely safe and painless, so it is prescribed even to those patients who are in serious condition. However, there are still several factors due to which the phonocardiograph microphone cannot be placed close to the chest, and they may become contraindications for this procedure.
Such factors include severe obesity, as well as violation of the integrity of the breast skin such as trauma, burns or wounds. In addition, FCG is not recommended for patients who drank coffee in the morning, as it increases blood pressure, which means the study result will be unreliable.
Research process
A study using the phonocardiography method is a procedure that is carried out using a phonocardiograph, consisting of a microphone and an amplifier, which help to hear all the sounds of the heart, a frequency filter that eliminates interference and makes the sound clearer, and a recording device, thanks to which we get a phonocardiogram in our hands with a detailed description of the strength and frequency of the sound, as well as all murmurs and heart sounds.
To get the correct result, before attaching six microphones to the chest, the doctor listens to the patient, and then lays him horizontally, installs the elements of the device on the chest and examines the work of the heart for ten minutes.
If necessary, the patient may be asked to turn over on his side during the procedure, hold his breath, or take a deep breath. In parallel with the PKG, the patient is additionally given an ECG, which makes it possible to compare all the sounds recorded by the phonocardiograph with the electrical activity of the heart. The entire procedure in this case takes a maximum of 10 minutes.
Advantages and disadvantages of phonocardiography
Like any diagnostic method, FCG has advantages and disadvantages. The advantages are considered:
- The objectivity of the data obtained about the nature of sounds and their graphic display;
- The ability to determine the physical parameters of sound - strength, frequency, interval between tones or noises;
- The ability to objectively compare sounds occurring at a certain interval, which is difficult to do using a phonendoscope;
- Determination of the relationship with the electrical activity of the heart when used simultaneously with an ECG.
Along with the advantages, the FCG method is not without its disadvantages. Of course, the device can “hear” low-frequency vibrations that are inaccessible to the doctor, but still the ear is more sensitive, so some weak sounds in the audibility range can be detected by the doctor, but not displayed on the FCG.
In addition to the low-frequency third, fourth and fifth tones, all other sounds should be audible through the phonendoscope and reflected on the FCG. If the device indicates the presence of sound vibrations that are not audible during auscultation, then the doctor still bases the conclusions on data from listening to the ear (with the exception of low-frequency recordings). Thus, without auscultation, FCG analysis is meaningless.
In addition, the device cannot determine the timbre of the sound; this is done by a person. Timbre is a subjective characteristic, but it significantly helps in diagnosing some valvular heart defects.
To place the microphone at the points where sounds will be heard maximum, preliminary auscultation is used. Many heart diseases are accompanied by changes in its configuration and size, expansion and displacement of the boundaries and, accordingly, the places of best audibility of sound waves, and incorrect position of the microphone will lead to a decrease in sound strength.
Correct registration and interpretation of PCG data is impossible without previous auscultation, and sounds are assessed based on subjective characteristics determined by the doctor and objective physical data recorded by the device. Recently, PCG has begun to be used in the prenatal diagnosis of fetal hypoxia and congenital heart rhythm disorders.
Study of fetal heart function
Also, using phonocardiography, the physiology of the sound waves emitted by the beating heart of the baby in the womb can be studied to find out how the fetus is developing and whether there are any complications. In this case, the microphone is attached to the area of the pregnant woman's abdomen where the tones of the fetal heart are best heard.
And when the mother begins to give birth, the microphone is moved even lower, to the pubic symphysis. And in this case, FCG is already done from the very contractions until birth, in order to know that they are proceeding normally, focusing on the phonocardiogram indicators, where it should be clear that the heart sounds are even and are heard at equal intervals. The only thing is that when a woman pushes and contractions begin, the amplitude of the second tone increases, but then the height levels out again.
But if phonocardiography of the fetus shows a heart murmur, an increase or decrease in the rhythm frequency, a change in the tone or strength of the sound, or its splitting, this may indicate peritoneal asphyxia, and then the gynecologist must do something to ensure that the birth proceeds normally.
How is FCG performed?
After understanding the structure of phonocardiography, you can understand exactly on what principle it is carried out. For the study, six microphones are attached to the patient’s chest to listen to sound impulses. They subsequently transform sound impulses into electrical ones.
After which, they are processed by a special apparatus, unnecessary noise is eliminated, and everything else is reflected on paper. These are the test results that the patient provides to the doctor for diagnosis.
Phonocardiography has no side effects and can be applied to any category of patients.
During the examination, the patient is laid horizontally, he takes a deep breath and holds his breath. The sensors are installed in different places, depending on the listening parameters with the phonendoscope.
The duration of the entire procedure, in most cases, does not exceed ten minutes, and in the case of a study with samples, no more than thirty minutes.
Features of fetal FCG
When studying an embryo in the womb, sensors are installed on the front wall of the woman’s abdomen, in those places where heart sounds are heard best during auscultation.
Listening to tones at regular intervals indicates normal labor. During contractions, the amplitude of the second tone increases, but after they are over, it is restored.
Sound amplitude
The main factor that phonocardiography examines is the amplitude of sounds, an increase or decrease in which indicates the presence of various diseases in the patient.
- The appearance of sounds III and IV on the phonocardiogram may indicate myocardial infarction or hypertension, while the first often signals heart failure, and the second indicates increased contraction of the atria or ventricular hypertrophy.
- An increase in tone II may indicate pulmonary or arterial hypertension, and a decrease in tone may indicate a deterioration in blood flow through the pulmonary artery or aortic valve insufficiency.
- Strengthening of the first tone can be observed with hyperthyroidism, anemia or stenosis of the bicuspid valve, and its weakening indicates dilation of the bronchioles, inflammation of the pericardium or exudative pleurisy of the lung on the left side, in addition, a weak first tone occurs in overweight people.
- An increase in the amplitude of the first tone may indicate mitral stenosis, and its decrease may indicate pathology of the heart muscle, cardiac decompensation, or slowing of atrioventricular conduction.
- A reduction in the intensity of the first tone on the phonocardiogram may be caused by problems with the contractile function of the left ventricle. This phenomenon can often be observed in diseases such as chronic cardiac ischemia, myocardial dystrophy, rheumatic carditis or cardiomyopathy.
Normal FCG
The patient, having received the result of a particular study, usually immediately makes efforts to independently decipher it. If in the case of blood tests this can, at the very least, be done independently, then FCG is a method that lies beyond the capabilities of the average person. To interpret data, you need to master the auscultation method, the basics of which are taught at universities, and experience is gained through practice in the field of cardiology and therapy.
A healthy heart allows you to hear the first and second sounds - these are normal and basic indicators of its functioning.
1,2,3,4 heart sounds on FCG and comparison with ECG
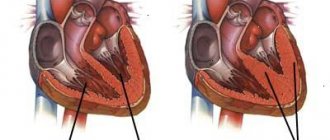
The first sound is formed when the valves located between the atria and ventricles close. The “slamming” of the valve flaps produces a fairly loud sound of medium frequency, the amplitude of which on the FCG reaches 25 mm, and the duration is 0.15 seconds. It is impossible to isolate the sounds of each valve separately; everything happens very quickly and sound vibrations, overlapping each other, give a single first tone.
Correlating the characteristics of the first tone with ECG data, the time of its appearance is given important diagnostic significance. Normally, the interval between the beginning of the Q wave and the beginning of the first tone on the PCG is no more than 0.06 s, and its increase indicates pathology.
The second heart sound characterizes the closure of the pulmonary artery and aortic valves. It is best heard in the second intercostal space to the right and left of the sternum, that is, at the points closest to the base of the heart. Unlike the first tone, the second has two components coming from each valve. These sounds can be distinguished both by the ear and on the device. This phenomenon is especially noticeable in thin people, teenagers and children.
The first sound wave arises from the closure of the aortic valve, it is louder, and its amplitude can exceed the sound from the pulmonary valve by one and a half to two times. This is due to the fact that the pressure in the aorta is much higher than in the pulmonary artery. The next sound appears when the pulmonary valve flaps “slam”, and the interval before its appearance should not exceed 0.06 seconds, otherwise we can talk about the splitting of the second tone. On the ECG, at the moment the second tone appears, the T wave has already ended, or a maximum of 0.4 seconds has passed from the moment of its end.
The third and fourth heart sounds are recorded on FCG quite rarely. When identifying them, you should not make hasty conclusions, and talk about pathology only after a detailed examination. Normally, the third tone can be present in subtle adults, children and adolescents; it consists of sounds produced by the vibration of the walls of the ventricles, so changes in the heart muscle may well be accompanied by its appearance.
It is worth noting that the appearance of the third tone is associated with physical activity, which often occurs in healthy people. It is difficult to listen to it, and the recording occurs in the low-frequency range.
The fourth tone is rarely detected, but, unlike the third, it often indicates pathology. On the ECG it appears after the maximum of the P wave; this noise is low-amplitude and low-frequency.
Video: normal heart sounds, educational video
Heart murmurs
Of no small importance when decoding a phonocardiogram are recorded heart murmurs, which can also be used to judge whether this human organ is functioning well.
- Presystolic murmur may indicate the development of mitral stenosis.
- Oval or diamond-shaped noise on the phonocardiogram indicates the development of aortic stenosis.
- Diastolic murmur may herald the development of aortic insufficiency.
- A band-like systolic murmur that occurs at a low frequency may indicate tricuspid valve insufficiency.
- Functional murmurs occur only in children and can indicate both the development of certain pathologies in them and the health of the child, so they should be judged only in conjunction with all other factors of the PCG and ECG.
Phonocardiogram in normal and pathological conditions.
Study time: 2 hours.
Purpose of the lesson: to know: the principle of the method and characteristics of the phonocardiogram in healthy individuals and in patients with heart defects; be able to: analyze a phonocardiogram and graphically reproduce auscultation data obtained at the patient’s bedside; be familiar with: the device of a phonocardiograph and the method of recording a phonocardiogram.
Questions for theoretical preparation:
Phonocardiogram. Definition of the method, registration technique, diagnostic value. Characteristics of a normal phonocardiogram. The concept of electrical and mechanical systole of the heart, other time relationships. Changes in tones on the phonocardiogram (intensification, weakening, bifurcation). Intracardiac heart murmurs. Phonocardiographic differences between functional and organic noises. Phonocardiographic signs of mitral valve insufficiency, tricuspid valve insufficiency, aortic stenosis, mitral stenosis, aortic semilunar valves.
Content:
Phonocardiography (PCG) is a method of recording sound phenomena occurring in the heart during its operation.
It is a significant addition to cardiac auscultation and allows you to identify and record low-frequency sounds that are poorly heard by the ear, estimate the amplitude and duration of sounds, and also determine different time intervals.
FCG recording is carried out by a phonocardiograph - a device whose main components are a microphone that perceives sound vibrations and converts them into electrical waves, an amplifier with frequency filters and a recording device.
A prerequisite for recording a phonocardiogram is its synchronous recording with the electrocardiogram.
The placement of the microphone is determined by preliminary auscultation of the heart. Most often these are the places where the heart valves are heard and the additional “0” point (V intercostal space on the left in the axillary region).
Frequency ranges of FCG registration:
low frequency (H) from 0 to 35 Hz,
first average frequency (C1) from 35 to 70 Hz,
second average frequency (C2) from 70 to 140 Hz,
high 140 - 250 Hz.
FCG analysis and a diagnostic conclusion on it are carried out only taking into account auscultatory data. For correct interpretation of the PCG, an ECG is simultaneously recorded simultaneously with it.
Normal PCG consists of oscillations reflecting the I and II heart sounds, between which there is a straight line corresponding to the systolic and diastolic pause. During the diastolic pause, fluctuations caused by the III, IV and V heart sounds are sometimes recorded.
Tone I is represented by several oscillations that occur after the Q wave of a synchronously recorded ECG. Initial low amplitude oscillations of the first tone are associated with atrial systole. The main, central part of the first tone is represented by two or three high-amplitude oscillations, which are determined at the level of the S wave and correspond to oscillations of closed atrioventricular valves. Following the main part of the first tone, additional vibrations of lower amplitude are recorded, caused by vibration of the myocardium and the vascular component. The intensity of the sound is determined by the amplitude of the vibrations. On FCG, the amplitude of oscillations depends not only on the work of the heart, but also on the conditions for conducting sounds (for example, with obesity, pulmonary emphysema, the amplitude of sounds decreases).
The amplitude of the first tone is highest at the apex of the heart, where it is ½ times higher than the amplitude of the second tone (I: II = 3: 2); at the base of the heart, the amplitude of the first tone can be very small. When assessing the first sound at the apex of the heart, one notices that its central part lags somewhat behind the Q wave of the synchronously recorded ECG. Normally, this QI tone interval does not exceed 0.04-0.06 s. It corresponds to the time between the onset of excitation, the ventricles and the closure of the mitral valve. When pressure in the left atrium increases (for example, with mitral stenosis), the mitral valve closes later and the QI interval increases.
Tone II is represented by a group of oscillations appearing at the end of the T wave of a synchronous ECG. The first higher oscillations correspond to the closure of the aortic valve, and the following ones, of lower amplitude, are due to the closure of the pulmonary valve. The amplitude of the second tone is higher at the base of the heart, where it exceeds the amplitude of the first tone. The amplitude of the second tone on the aorta is related to the amplitude of the second tone on the pulmonary trunk as 2:1.
On the FCG, in addition to the 1st and 2nd tones, the 3rd tone is often noted, which is recorded in the form of two or three low-frequency oscillations of small amplitude, following 0.12-0.18 s after the 2nd tone and located before the P wave of a synchronously recorded ECG. Less commonly, the IV tone is recorded in the form of one or two low-frequency, small-amplitude oscillations, appearing after the P wave. Sometimes the V tone is recorded in the form of one or two low-frequency, small-amplitude oscillations, located in the middle of diastole.
FCG is of great help in diagnosing many diseases of the cardiovascular system and, first of all, heart defects. It helps to clarify and supplement auscultation data. This is especially important in case of tachycardia, arrhythmias, when with the help of auscultation alone it is difficult to decide in which phase of the cardiac cycle certain sound phenomena occurred.
FCG helps to identify changes in tones, their bifurcation, splitting, and to correctly interpret the appearance of additional tones: physiological III and IV tones, the tone of the mitral valve opening, gallop rhythm.
The first sound is enhanced if its amplitude at the apex of the heart is more than 2 times higher than the amplitude of the second sound, which is typical for mitral stenosis. When the first tone weakens, its amplitude at the apex of the heart is equal to or less than the amplitude of the second tone. Weakening of the first tone is observed with a decrease in the contractile function of the myocardium, an increase in blood filling of the ventricles, and the absence of a period of closed valves in the phase of isometric ventricular tension.
The first tone is said to be bifurcated if the interval between its central components increases by more than 0.07 s. This occurs with bundle branch block and is called galloping systolic murmur. A pathologically enhanced IV tone, combined with atrioventricular block (P-Q more than 0.2 s) is called a presystolic gallop rhythm, and a pathologically enhanced III tone is defined as a protodiastolic gallop rhythm.
An increase in the second tone in the aorta is observed with an increase in pressure in the systemic circulation (hypertension, symptomatic hypertension).
Weakening of the second tone in the aorta is recorded with stenosis of the aortic mouth, collapse, hypotension.
Increased tone II in the pulmonary artery reflects hypertension in the pulmonary circulation (mitral stenosis, chronic nonspecific lung diseases, left ventricular failure).
Bifurcation of the second tone in the aorta or pulmonary artery occurs with significant hypertension in the systemic or pulmonary circulation. In this case, the semilunar valves of the aorta and pulmonary artery do not close simultaneously.
In the diagnosis of stenosis of the left atrioventricular orifice (mitral stenosis), the opening tone of the mitral valve, which is often designated by the letters OS (from the English opening snap), is of great importance. Unlike the third tone, it is recorded at high frequencies 0.06-0.11 s after the second tone. This interval II sound - QS, as well as the interval QI sound, depends on the pressure in the left atrium: the higher it is, the earlier during diastole the mitral valve opens and the faster the interval II tone - QS wanders.
Phonocardiography provides significant assistance in determining the nature of cardiac murmurs. The FCG is used to judge the time of noise appearance, the location of its maximum intensity, duration and frequency response, which is determined by the predominant intensity of the noise recorded on the high- or low-frequency channel. On FCG, noise appears as a group of oscillations of varying amplitude (depending on the intensity of the noise), appearing during a systolic or diastolic pause.
Systolic murmur may occupy part or all of the systole, may be located between the 1st and 2nd sounds, or merge with them. Pay attention to the configuration of oscillations associated with systolic murmur, which can be diamond-shaped, spindle-shaped, ribbon-shaped, etc. This is important in the diagnosis of heart defects. For example, diamond-shaped or spindle-shaped vibrations that form a systolic murmur that does not merge with the second sound are characteristic of aortic stenosis.
When assessing diastolic murmur, the first thing to note is at what point in diastole it appears, i.e. whether it is protodiastolic, mesodiastolic or presystolic. Then the change in noise intensity (decreasing or increasing noise) and its frequency response are determined.
It is known that diastolic noise during aortic valve insufficiency (aortic insufficiency) is better recorded on a high-frequency channel. When phonocardiographic diagnosis of noise, attention is paid to the presence of an interval between the noise and the previous tone. This interval makes it possible to distinguish noises caused by stenosis of the orifices from noises associated with regurgitation of blood due to valve insufficiency. With stenosis of the orifices, the noise is separated from the previous tones by an interval that corresponds to the period of closed valves, when no blood movement is recorded.
With valve insufficiency, the noise is adjacent to the previous tone without intervals, since with a valve defect, reverse blood flow occurs as soon as the valve closes.
Different frequency characteristics of murmurs and different times of their appearance during a certain phase of the cardiac cycle help to identify combined lesions of the valvular apparatus of the heart.
Phonocardiographic signs of functional murmurs are as follows: they are often systolic, recorded at the apex or pulmonary artery. They are short-lived (end in the middle of the pause), are not carried out, are not accompanied by changes in tones corresponding to the noise, are recorded more often at low frequencies, and are non-constant noises.
FCG for heart defects:
Mitral valve insufficiency:
The first tone is weakened because there is no period of closed valves. Systolic murmur at the apex of the heart, medium- and high-frequency, medium-amplitude, merges with the first sound, decreasing in shape, carried out to the “0” point.
Accent of P tone over the pulmonary trunk with increased pressure in the pulmonary circulation.
Narrowing of the left atrioventricular orifice:
(mitral stenosis)
At the apex, a high amplitude of the first tone, a click of the opening of the mitral valve after the second sound, a diastolic noise (protodiastolic after the click of the opening of the mitral valve, mid- and high-frequency, decreasing in shape and presystolic, increasing in shape, merging with the first sound, mid- and high-frequency) are recorded ). Above the pulmonary artery, the amplitude of the second tone increases, compared to the aorta. The QI tone interval increases (more than 0.06 s).
Aortic valve insufficiency:
At the apex, the first sound is weakened, since during systole of the left ventricle there is no period of closed valves; the second sound at the aorta is also weakened. Diastolic murmur is recorded on the aorta and at the Botkin-Erb point, predominantly mid-frequency, mid-amplitude, decreasing in shape, occupying 2/3 -3/4 of diastole.
Aortic stenosis:
Decrease in the amplitude of the first tone at the apex of the heart and the amplitude of the second tone above the aorta. A diamond-shaped systolic murmur is recorded above the aorta; it is not associated with heart sounds, medium-high-frequency, high-amplitude.
Right atrioventricular valve insufficiency:
(tricuspid insufficiency)
The first tone at the base of the xiphoid process is weakened. Systolic murmur is recorded at the base of the xiphoid process, as well as in the third and fourth intercostal spaces to the right of the sternum, mid-frequency, low-amplitude, decreasing in shape, occupying up to 2/3 of systole. The amplitude of the noise is higher when holding the breath at the height of inspiration. The amplitude of the second tone above the pulmonary trunk is reduced.
Equipment, visual aids:
Normal and pathological phonocardiograms. Tables. Computer animation.
Independent work plan:
Independently analyze the obtained phonocardiograms in the following order: 1) identify the tones and give their characteristics.
The first tone is located after a long diastolic pause and is determined at the level of the S wave. The amplitude of the first tone is assessed by the maximum oscillations of its central segment, recorded at the apex and at the base of the xiphoid process. In the area of the apex at auscultatory frequencies, the amplitude of the first tone is 1.5 times greater amplitudes of the second tone.
The second sound is located at the end of the T wave on a synchronously recorded ECG. The amplitude of the second tone is assessed on the aorta and pulmonary artery. The II tone on the aorta relates to the II sound on the pulmonary artery as 2:1.
The third tone on PCG is determined in the form of 1–2 oscillations of small or medium amplitude, which are recorded at the apex of the heart at low frequencies. The third tone is recorded after 0.12–0.18 seconds. after the second tone.
The IV tone is recorded at the end of the P wave of a synchronously recorded ECG, often at the base of the heart. The IV tone is determined in the form of 1–2 low-frequency oscillations of small amplitude. If there is a III or IV tone on the ECG, it is necessary to pay attention to the presence of high-frequency components in their composition (pathological III and IV tones).
It is convenient to change the time intervals between tones using maximum oscillations. The Q–I sound interval is measured from the beginning of the Q (or R) wave to the beginning of the central segment of the I sound at the apex of the heart (normally it is 0.04-0.06 seconds).
If there are murmurs, indicate in what phase of cardiac activity they are recorded. For systolic murmurs, determine whether they occupy the entire systole or part of it. For diastolic murmurs, it is important to indicate their beginning: immediately after the second sound or at an interval after it, in what phase the murmur is recorded (protodiastole, mesodiastole, presystole). Describe the configuration of the noise, find all the points of its registration and the point of maximum severity, which allows you to resolve the issue of its origin and transmission to other points. Give the frequency characteristics of noise.
Examples of recording the results obtained: at the apex of the heart, the first sound is of large amplitude, high-frequency, the ratio to the second sound is 3:1. On the pulmonary artery, a splitting of the second tone of 0.05 seconds is recorded, not associated with breathing. The pulmonary component of tone II exceeds the aortic component in amplitude. At the apex of the heart, a diastolic murmur is recorded, which occupies the entire diastole, increasing in presystole.
Test tasks:
- Draw a FCG for mitral stenosis.
- Draw a FCG for mitral valve insufficiency.
- Draw a FCG for aortic stenosis.
- A low-amplitude, high-frequency diastolic murmur is recorded on the aorta, occupying the entire diastole. What other pathological changes on FCG will be in this case? What vice is this typical for?
Literature.
Main:
A.L. Grebenev. Propaedeutics of internal diseases. Moscow, 1995
Fundamentals of semiotics of diseases of internal organs. Atlas ed. A.Z. Strutynsky and others. Moscow, RGMU, 1997
Lecture on the topic of the lesson.
Additional:
Guide to practical classes on propaedeutics of internal diseases (edited by O.D. Dovgyallo and others) Minsk, “Higher School”, 1986
B.S. Shklyar. Diagnosis of internal diseases Kyiv “Vishcha School” 1972