Stages of development of a heart attack with ST segment elevation
The most acute stage of STEMI
First, a high coronary T appears on the cardiogram. The high coronary T before ST elevation is present for a very short time, so it is not always possible to register it. Then there is an increase in the ST segment, which merges with a high T.
Scheme 2. ECG fragments in the most acute stage of STEMI
Acute stage STEMI
Lasts up to 2-3 days (sometimes up to 2 weeks). The beginning of the acute phase is considered to be the appearance of the Q wave, which reflects the formation of a zone of myocardial necrosis. As the acute phase develops, the Q wave deepens, and the ST segment begins to decline towards the isoline. The T wave becomes negative.
Scheme 3. ECG fragment in the acute stage of STEMI
Subacute stage of STEMI.
Lasts for several weeks. The ECG records a decrease in the ST segment to the level of the isoline. At the same time, a deep negative T wave is formed.
Scheme 4. ECG fragment in the subacute stage
Scar stage STEMI
Dead myocardial cells are replaced by connective tissue, which leads to the formation of a scar. The areas of the myocardium surrounding the scar undergo compensatory hypertrophy. The number of leads on the ECG in which changes associated with a heart attack are recorded is reduced. The Q wave may become less deep, and the T wave returns to the baseline. The formed picture of post-infarction cardiosclerosis on the ECG persists throughout the patient’s life.
Sometimes the ST segment does not reach the isoline and remains elevated almost throughout life. As a rule, the QRS complex takes on the QS form, which may indicate the formation of a cardiac aneurysm.
Scheme 5. ECG fragments with post-infarction changes
Diagram 5 on the left shows a fragment of a cardiogram indicating a myocardial infarction. On the right is a fragment of a cardiogram in which the ST segment has not reached isolia and a QS complex has formed, turning into increased ST. This picture is called a “frozen ECG” and indicates a post-infarction cardiac aneurysm.
Localization of infarction with ST elevation
Changes in cardiograms during a heart attack with ST segment elevation vary depending on which part of the heart the heart attack develops in. The location of the infarction can be determined by the ECG leads in which ST elevation is recorded and in which leads reciprocal ST depression appears. In this regard, remember which leads correspond to different parts of the myocardium. Look at diagram 6.
Scheme 6. Correspondence of cardiogram leads to different areas of the myocardium.
Schema source.
Diagram 7 below shows the location of large coronary arteries, the occlusion of which can lead to transmural infarction with appropriate localization.
Scheme 7. Large coronary arteries
| Localization of infarction | ST elevation leads | Leads with reciprocal ST depression |
| Interventricular septum | V1-V2 | |
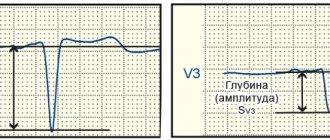
| Front wall | V3-V4 | |
| Lateral wall of the left ventricle | I, aVL, V5-V6 | III, aVF |
| Bottom wall | II, III, aVF | I, aVL |
| Back wall | V7-V9 | V1-V3 (and high R in V1-V3) |
| Right ventricle | V1, III, II (STIII > STII), V3R - V5R | V2 |
The table above shows which leads show ST elevation or depression depending on the location of STEMI. In practice, ST elevation infarction usually affects more than one area. For example, an infarction of the interventricular septum is usually combined with an infarction of the anterior wall of the left ventricle. In this case, ST elevation will be not only in leads V1-V2, but also in V3-V4.
Let's consider STEMI options with different localizations.
Interventricular septal infarction
As mentioned above, isolated septal infarction is a rare occurrence (usually septal and anterior wall infarction). Septal infarction develops as a result of occlusion of the left anterior descending artery (LAD). The cardiogram records ST elevation in leads V1-V2.
Scheme 8. Infarction of the interventricular septum
ECG 2. Myocardial infarction of the interventricular septum
ECG source.
On ECG 2, an infarction of the interventricular septum is indicated by pathological Q waves in leads V1-V2 and moderate ST elevation in the same leads. Judging by the ST height and the presence of Q waves, this is a subacute stage of infarction. In addition, in this case there is diffuse ST segment depression in leads I, II, V4-V6 in combination with ST elevation in aVR. This indicates subendocardial myocardial ischemia.
Symptoms of depression of the ischemic segment
ST segment depression (what is it, people often ask) leads to the appearance of coronary artery disease. It is difficult to recognize based on clinical symptoms. Detection of pathology is rarely observed during a medical examination. The main symptom is pain that occurs behind the sternum, where the source of pain is located.
Additional visual characteristics of the diagnosis include: cold sweat, bluish skin, rapid breathing, and muscle fatigue.
To assess the ability of the heart muscles to respond to an increase in heart rate, it is necessary to do tests with physical activity.
When a person is healthy, he has no pathologies, since the heart reacts adequately to a possible increase in load. During physical activity, arterial hypertension decreases, and sometimes there is an increase in systolic pressure.
After a patient has suffered a myocardial infarction, the cause of low blood pressure is myocardial ischemia. When the heart beats are repeated abnormally frequently, reduced cardiac functionality is evidence of ventricular dysfunction. This situation occurs when cardiotropic drugs are used.
Anterior wall infarction
ST elevation infarction in the anterior wall region develops as a result of occlusion of the left anterior descending artery (LAD). The cardiogram records ST elevation in leads V3-V4. A reciprocal decrease in ST occurs in the inferior leads: III, aVF. Subsequently, pathological Q is formed in V3-V4.
Scheme 9. Infarction of the anterior wall
An infarction of the anterior wall, as a rule, is not isolated and is most often combined with an infarction of the interventricular septum and/or an infarction of the lateral wall of the left ventricle. This is determined by the fact that the interventricular septum and lateral wall are also supplied by the left anterior descending artery (LAD).
ECG 3. Infarction of the septum, anterior wall and partly the lateral wall of the left ventricle
ECG source.
On ECG 3, ST elevation in leads V1-V4, as well as deep Q waves in V1-V2, indicate infarction in the area of the interventricular septum (ST elevation in V1-V2) and the anterior wall of the left ventricle (ST elevation in V3-V4). There are tall coronary T waves in V2-V4. There is also slight ST elevation in leads I, aVL and V5, which may indicate extension of the infarction to the lateral wall of the left ventricle.
There is a reciprocal decrease in ST in lead III. These are signs of the acute phase of myocardial infarction with ST elevation.
ECG 4. Infarction of the anterior and lateral walls of the left ventricle
ECG source.
On ECG 4 there is ST elevation in leads V2-V6, I, aVL. Elevation in V3-V4 with maximum elevation in V3 indicates an infarction of the anterior wall, and ST elevation V5-V6, I, aVL indicates an infarction of the lateral wall of the left ventricle. In III and aVF there is reciprocal ST depression.
ECG 5. Extensive infarction of the interventricular septum, anterior and lateral walls of the left ventricle. “Tombstoning” pattern
ECG 5 shows massive ST segment elevation in leads V1-V6, I, aVL, reciprocal ST decrease in leads III and aVF. This morphological pattern on the cardiogram is called the “tombstoning” pattern and indicates occlusion of the proximal LAD. A prognostically unfavorable option with a high probability of damage to a large part of the myocardium with a sharp decrease in cardiac contractility and the development of cardiogenic shock.
T wave changes in ischemic heart disease
With ischemic heart disease, the T wave can be changed in two situations.
- With ischemia associated with an attack of angina, a negative T wave may be recorded in two (or more than two) adjacent leads.
- In the acute phase of myocardial infarction with ST elevation, a high positive T may be recorded.
Look at ECG 5 with an example of ischemia and inverted T waves.
ECG 5. Negative T waves in myocardial ischemia
ECG source.
ECG 5 shows inverted T waves in the left leads: V5-V6, I, aVL.
Negative T values indicate ischemia if the following conditions are met.
- The depth of negative T must be at least 1 mm.
- Negative T waves must be recorded in at least two adjacent leads.
- The QRS complex before the negative T has a tall positive R wave.
- Dynamics of change. These should be “new” inverted Ts (they should not be on old cardiograms). Within some time (hours or days) there should be a return of the T wave to the isoline.
In addition, it should be remembered that inverted T wave in leads III, aVR, V1 is a normal variant.
ECG 6 shows another example of a change in the T wave in coronary artery disease: high coronary T wave in the acute phase of myocardial infarction with ST elevation. This is the initial and very short period of a heart attack, so it is not always possible to register it on an ECG.
ECG 6. High positive T wave in the acute phase of myocardial infarction
ECG source.
Left ventricular lateral wall infarction
Left ventricular lateral wall infarction with ST elevation, as discussed above, is usually associated with anterior wall infarction. In addition, it can be combined with infarction of the lower or posterior wall. It develops as a result of occlusion of the left anterior descending artery (LAD) and/or the circumflex coronary artery (LCX).
Isolated lateral wall infarction is less common and is associated with occlusion of the small branches of the LAD or the marginal branch of the LCX.
Scheme 10. Infarction of the lateral wall of the left ventricle
On the cardiogram with a lateral wall infarction, ST elevation is recorded in leads I, aVL, V5-V6. If ST elevation is only in leads I, aVL, but not in leads V5-V6, they speak of a high lateral infarction. A reciprocal decrease occurs in leads III, aVF.
Examples of lateral wall infarction combined with anterior wall infarction were shown above (see ECG 3-5).
ECG 6. High lateral left ventricular infarction
ECG source.
ECG 6 shows ST elevation in leads I and aVL, as well as reciprocal depression in leads III, aVF. There is no ST elevation in leads V5-V6. These are signs of high lateral left ventricular infarction.
ECG No. 3
Well, another ECG with a lateral wall infarction (I, AVL, usually there is also V5-V6, but not always), I think explanations are unnecessary.
ECG No. 4
And the last ECG with anterolateral infarction. There is some isoline drift here, so I chose the most “clean” area for measurements.
In general, this material is sufficient for our modest purposes. And you can try to complete the task to consolidate the material you have covered. TASK 5.3
Or, if you prefer, let’s move on to “Scar Changes”
If you find any error, please select a piece of text and press “ Ctrl+Enter”
Infarction of the inferior wall
Inferior wall infarction with ST elevation in most cases (up to 80%) develops as a result of occlusion of the right coronary artery (RCA). In this case, the infarction of the lower wall can be isolated or combined with a right ventricular infarction.
Scheme 11. Infarction of the inferior wall
Less commonly, inferior wall infarction may be caused by occlusion of the left circumflex artery (LCX). This option can lead to the development of infarction of the lower and posterior wall, which has a worse prognosis due to the larger area of myocardial damage.
In rare cases, it is possible to develop a lower infarction with distal occlusion of the left anterior descending artery (LAD). This leads to a combination of infarction of the anterior and inferior walls.
In case of infarction of the lower wall, elevation of the ST segment and the subsequent formation of a pathological Q wave in leads II, III, aVF are recorded on the cardiogram. Reciprocal ST depression occurs in lead aVL and (not always) in lead I.
ECG 7. Inferior wall infarction with ST elevation
ECG source.
ECG 7 shows ST elevation and Q waves in leads II, III, aVF. At the same time, there is reciprocal ST depression in leads I and aVL. These changes indicate STEMI of the inferior wall of the left ventricle.
Posterior wall infarction
An infarction of the posterior wall, as a rule, develops in combination with an infarction of the lower or lateral wall of the left ventricle. Isolated posterior wall infarction occurs in no more than 10% of cases. However, isolated posterior wall infarction is not always recognized in a timely manner, since it develops infrequently and there is no ST segment elevation on a standard 12-lead cardiogram. To confirm this diagnosis, it is necessary to use additional posterior leads: V7-V9. Posterior wall infarction can be suspected from a 12-lead ECG based on the following signs:
- ST segment depression in leads V1-V3. This ST depression is reciprocal to ST elevation in the accessory posterior leads (V7-V9).
- Tall and usually widened R waves in leads V1-V3.
- The R/S ratio in V2 is greater than 1.
- Positive T wave in leads V1-V3.
ECG 8. Infarction of the posterior and inferior wall of the left ventricle with ST elevation
ECG source.
On ECG 8, ST segment depression, as well as a tall and wide R wave in leads V2-V3, indicate infarction in the posterior wall of the left ventricle. To confirm this diagnosis, a cardiogram was recorded using additional leads V7-V9, where ST elevation was recorded. In addition, in leads III, aVF, slight elevation of the ST segment was also recorded, which indicates involvement of the lower wall of the left ventricle in the process.
ECG 9. Infarction with ST elevation of the lateral and posterior wall of the left ventricle
ECG source.
On ECG 9, ST elevation in leads I, aVL, V5-V6 and reciprocal ST depression in leads III, aVF reflect infarction of the lateral wall of the left ventricle. In addition, there is a decrease in ST in leads V1-V3, which, in combination with high R waves in these same leads, may indicate posterior wall damage. Thus, in this case there is an infarction of the lateral and posterior wall of the left ventricle. To confirm posterior wall infarction, an ECG should be recorded in additional posterior leads (V7-V9).
Causes and clinical significance of the ECG phenomenon of ST segment elevation
W. Brady et al. analyzed the results of emergency physicians' assessment of 448 ST-segment elevation ECGs. Erroneous assessment of the ECG in the form of overdiagnosis of acute myocardial infarction (MI) with the subsequent administration of thrombolytic therapy to patients was detected in 28% of cases with cardiac aneurysm (AC), in 23% with early ventricular repolarization syndrome (EVRS), in 21% with pericarditis and in 5% – with left bundle branch block (LBBB) without signs of MI. Assessment of the ECG phenomenon, which consists of ST segment elevation, is complex and includes an analysis of not only the characteristics of ST changes and other ECG components, but also the clinical picture of the disease. In most cases, a detailed analysis of the ECG is sufficient to differentiate the main syndromes leading to ST segment elevation. ST changes can be a variant of a normal ECG, reflect non-coronarogenic changes in the myocardium and cause acute coronary pathology requiring emergency thrombolytic therapy. Thus, therapeutic tactics for patients with ST segment elevation are different. 1. Normal Concave ST segment elevation is acceptable in the limb leads up to 1 mm, in the chest leads V1–V2, sometimes V3 up to 2–3 mm, in leads V5–V6 up to 1 mm (Fig. 1). 2. Myocardial infarction with ST segment elevation (MI) MI is necrosis of a portion of the heart muscle that occurs as a result of absolute or relative insufficiency of coronary circulation. Electrocardiographic manifestations of ischemia, damage and necrosis of the myocardium depend on the location, depth of these processes, their duration, and the size of the lesion. It is believed that acute myocardial ischemia manifests itself mainly by changes in the T wave, and damage - by displacement of the ST segment, necrosis - by the formation of a pathological Q wave and a decrease in the R wave (Fig. 2, 4). The ECG of a patient with MI undergoes changes depending on the stage of the disease. At the stage of ischemia, which usually lasts from several minutes to 1–2 hours, a high T wave is recorded above the lesion. Then, as ischemia and damage spread to the subepicardial regions, ST segment elevation and T wave inversion are detected (from several hours to 1–3 days .). The processes occurring at this time can be reversible, and the ECG changes described above may disappear, but more often they move to the next stage, with the formation of necrosis in the myocardium. Electrocardiographically, this is manifested by the appearance of a pathological Q wave and a decrease in the amplitude of the R wave. 3. Prinzmetal's angina (AP) With the development of spasm of the epicardial artery and subsequent transmural damage to the myocardium, a rise in the ST segment is noted in the leads reflecting the affected area. In SP, the spasm is usually short-lived, and the ST segment returns to baseline without subsequent myocardial necrosis. With SP, the characteristic features are cyclical attacks of pain, a monophasic appearance of the ECG curve and cardiac arrhythmias. If the spasm continues long enough, an MI develops. The cause of vasospasm of the coronary arteries is endothelial dysfunction. ST segment elevation in SP and developing MI does not differ significantly, since it is a reflection of one pathophysiological process: transmural ischemia due to occlusion of the epicardial artery caused by transient spasm in the first condition and persistent thrombosis in the second (Fig. 3, 4). Patients with SP are predominantly young women who do not have classical risk factors for coronary heart disease (CHD), excluding smoking. SP is associated with such manifestations of angiospastic conditions as Raynaud's syndrome and migratory headaches. What these syndromes have in common is the possibility of developing arrhythmia. For the diagnosis of SP, tests with physical activity are not very informative. The most sensitive and specific provocative test is the intravenous administration of 50 mcg of ergonovine at 5-minute intervals until a positive result is obtained, while the total dosage of the drug should not exceed 400 mcg. A test with ergonovine is considered positive when an attack of angina and ST segment elevation on the ECG occur. To quickly relieve the symptoms of vasospasm caused by ergonovine, nitroglycerin is used. The dynamics of ST segment changes in SP can be monitored by long-term ECG recording using the Holter method. In the treatment of SP, vasodilators are used - nitrates and calcium antagonists; b-blockers and high doses of acetylsalicylic acid are contraindicated. 4. Cardiac aneurysm (AC) AC usually forms after transmural MI. Bulging of the ventricular wall causes stretching of adjacent areas of the myocardium, which leads to the appearance of a zone of transmural damage in the surrounding areas of the myocardium. On the ECG, AS is characterized by a picture of transmural MI, and therefore QS, occasionally Qr, is observed in most ECG leads. For AS, a “frozen” ECG is specific, which does not undergo dynamic changes in stages, but remains stable for many years. This frozen ECG has signs observed in stages II and III of ST-segment elevation MI (Fig. 5). 5. Early ventricular repolarization syndrome (ERRS) ERR is an ECG phenomenon consisting of registration of ST segment elevation up to 2–3 mm with a convexity downward, usually in many leads, most significantly in the chest leads. The transition point of the descending part of the R wave into the T wave is located above the isoline; often a notch or wave is determined at the place of this transition (“camel hump”, “Osborne wave”, “hat hook”, “hypothermic hump”, “J wave”) , the T wave is positive. Sometimes, as part of this syndrome, there is a sharp increase in the amplitude of the R wave in the chest leads, combined with a decrease and subsequent disappearance of the S wave in the left chest leads. ECG changes may decrease during exercise testing and regress with age (Fig. 6). 6. Acute pericarditis (AP) A characteristic ECG sign of pericarditis is a concordant (unidirectional with the maximum wave of the QRS complex) ST segment displacement in most leads. These changes are a reflection of damage to the subepicardial myocardium adjacent to the pericardium. In the ECG picture of AP, a number of stages are distinguished: 1. Concordant ST shift (ST elevation in those leads where the maximum wave of the ventricular complex is directed upward - I, II, aVL, aVF, V3-V6, and ST depression in the leads where the maximum wave is in QRS it is directed downward - aVR, V1, V2, sometimes aVL), turning into a positive T wave (Fig. 7). 2. The ST segment approaches the isoline, the T wave is smoothed out. 3. The T wave becomes negative in most leads (except aVR, where it becomes positive). 4. Normalization of the ECG (smoothed or slightly negative T waves can persist for a long time). Sometimes with pericarditis, involvement of the atrium myocardium in the inflammatory process is observed, which is reflected on the ECG in the form of a displacement of the PQ segment (in most leads - PQ depression), the appearance of supraventricular arrhythmias. With exudative pericarditis with a large amount of effusion on the ECG, as a rule, there is a decrease in the voltage of all teeth in most leads. 7. Acute cor pulmonale (ACP) During ACP, the ECG shows signs of overload of the right side of the heart for a short time (occurs with status asthmaticus, pulmonary edema, pneumothorax, the most common cause is thromboembolism in the pulmonary artery basin). The most characteristic ECG signs are: 1. SI-QIII - the formation of a deep S wave in lead I and a deep (pathological in amplitude, but usually not widened) Q wave in lead III. 2. Elevation of the ST segment, turning into a positive T wave (monophasic curve), in the “right” leads – III, aVF, V1, V2, combined with depression of the ST segment in leads I, aVL, V5, V6. In the future, the formation of negative T waves in leads III, aVF, V1, V2 is possible. The first two ECG signs are sometimes combined into one - the so-called McGean-White sign - QIII-TIII-SI. 3. Deviation of the electrical axis of the heart (EOS) to the right, sometimes the formation of EOS type SI–SII–SIII. 4. Formation of a high pointed P wave (“P-pulmonale”) in leads II, III, aVF. 5. Right bundle branch block. 6. Block of the posterior branch of the left bundle branch. 7. Increase in the amplitude of the R wave in leads II, III, aVF. 8. Acute signs of right ventricular hypertrophy: RV1>SV1, R in lead V1 more than 7 mm, RV6/SV6 ratio ≤ 2, S wave from V1 to V6, shift of the transition zone to the left. 9. Sudden appearance of supraventricular cardiac arrhythmias (Fig. 8). 8. Brugada syndrome (BS) BS is characterized by syncope and episodes of sudden death in patients without organic heart disease, accompanied by ECG changes in the form of permanent or transient right bundle branch block with ST segment elevation in the right precordial leads (V1–V3) . Currently, the following conditions and diseases that cause SB are described: fever, hyperkalemia, hypercalcemia, thiamine deficiency, cocaine poisoning, hyperparathyroidism, hypertestosteronemia, mediastinal tumors, arrhythmogenic right ventricular dysplasia (ARVD), pericarditis, MI, SP, mechanical obstruction of the right outflow tract ventricle tumors or hemopericardium, pulmonary embolism, dissecting aortic aneurysm, various anomalies of the central and autonomic nervous system, Duchenne muscular dystrophy, Frederick's ataxia. Drug-induced SB has been described during treatment with sodium channel blockers, mesalazine, vagotonic drugs, α-adrenergic agonists, β-adrenergic blockers, 1st generation antihistamines, antimalarials, sedatives, anticonvulsants, neuroleptics, tri- and tetracyclic antidepressants, lithium preparations. The ECG of patients with SB is characterized by a number of specific changes that can be observed in complete or incomplete combination: 1. Complete (in the classic version) or incomplete blockade of the right bundle branch. 2. Specific form of ST segment elevation in the right precordial leads (V1–V3). Two types of ST segment elevation have been described: “saddle–back type” and “coved type” (Fig. 9). The rise of the “coved type” significantly prevails in symptomatic forms of SB, while the “saddle-back type” is more common in asymptomatic forms. 3. Inverted T wave in leads V1–V3. 4. Increasing the duration of the PQ interval (PR). 5. The occurrence of paroxysms of polymorphic ventricular tachycardia with spontaneous cessation or transition to ventricular fibrillation. The last ECG sign mainly determines the clinical symptoms of this syndrome. The development of ventricular tachyarrhythmias in patients with SB often occurs at night or early in the morning, which makes it possible to associate their occurrence with activation of the parasympathetic component of the autonomic nervous system. ECG signs such as ST segment elevation and prolongation of the PQ interval may be transient. H. Atarashi proposed taking into account the so-called “S-terminal delay” in lead V1 - the interval from the top of the R wave to the top of the R wave. An extension of this interval to 0.08 s or more in combination with an ST rise in V2 of more than 0.18 mV is a sign of an increased risk of ventricular fibrillation (Fig. 10). 9. Stress cardiomyopathy (tako-tsubo syndrome, SCM) SCM is a type of non-ischemic cardiomyopathy that occurs under the influence of severe emotional stress, more often in elderly women without significant atherosclerotic lesions of the coronary arteries. Damage to the myocardium is manifested in a decrease in its contractility, most pronounced in the apical sections, where it becomes “stunned.” EchoCG reveals hypokinesis of the apical segments and hyperkinesis of the basal segments of the left ventricle (Fig. 11). In the ECG picture of SCM, a number of stages are distinguished: 1. Elevation of the ST segment in most ECG leads, absence of reciprocal depression of the ST segment. 2. The ST segment approaches the isoline, the T wave is smoothed out. 3. The T wave becomes negative in most leads (except aVR, where it becomes positive). 4. Normalization of the ECG (smoothed or slightly negative T waves can persist for a long time). 10. Arrhythmogenic dysplasia/cardiomyopathy of the right ventricle (ARVD) ARVD is a pathology that is an isolated lesion of the right ventricle (RV); often familial, characterized by fatty or fibrofatty infiltration of the ventricular myocardium, accompanied by ventricular arrhythmias of varying severity, including ventricular fibrillation. Currently, two morphological variants of ARVD are known: fatty and fibrofatty. The fatty form is characterized by almost complete replacement of cardiomyocytes without thinning of the ventricular wall; these changes are observed exclusively in the pancreas. The fibrofatty variant is associated with significant thinning of the pancreatic wall, and the process may involve the left ventricular myocardium. Also, with ARVD, moderate or severe dilatation of the pancreas, aneurysms, or segmental hypokinesia may be observed. ECG signs: 1. Negative T waves in the chest leads. 2. Epsilon (ε) wave behind the QRS complex in leads V1 or V2, which sometimes resembles incomplete RBBB. 3. Paroxysmal right ventricular tachycardia. 4. The duration of the QRS interval in lead V1 exceeds 110 ms, and the duration of the QRS complexes in the right precordial leads may exceed the duration of the ventricular complexes in the left precordial leads. The ratio of the sum of QRS durations in leads V1 and V3 to the sum of QRS durations in V4 and V6 has great diagnostic value (Fig. 12). 11. Hyperkalemia (HK) ECG signs of increased potassium content in the blood are: 1. Sinus bradycardia. 2. Shortening of the QT interval. 3. Formation of tall, pointed positive T waves, which, combined with a shortening of the QT interval, creates the impression of ST elevation. 4. Widening of the QRS complex. 5. Shortening, with increasing hyperkalemia - lengthening of the PQ interval, progressive impairment of atrioventricular conduction up to complete transverse block. 6. Reduced amplitude, smoothing of the P wave. With an increase in potassium levels, the complete disappearance of the P wave. 7. Possible depression of the ST segment in many leads. 8. Ventricular arrhythmias (Fig. 13). 12. Left ventricular hypertrophy (LVH) LVH occurs with arterial hypertension, aortic heart defects, mitral valve insufficiency, cardiosclerosis, and congenital heart defects (Fig. 14). ECG signs: 1. RV5, V6>RV4. 2. SV1+RV5 (or RV6) >28 mm in persons over 30 years of age or SV1+RV5 (or RV6) >30 mm in persons under 30 years of age. 13. Overload of the right and left ventricles The ECG with overload of the LV and RV looks identical to the ECG with hypertrophy, however, hypertrophy is a consequence of prolonged overstrain of the myocardium with excess blood volume or pressure, and changes in the ECG are permanent. One should think about overload when an acute situation occurs; changes on the ECG gradually disappear with the subsequent normalization of the patient’s condition (Fig. 8, 14). 14. Left bundle branch block (LBBB) LBBB is a conduction disorder in the main trunk of the left bundle branch before its division into two branches or simultaneous damage to two branches of the left bundle branch. Excitation spreads in the usual way to the RV and in a roundabout way, with a delay - to the LV (Fig. 15). The ECG shows a widened, deformed QRS complex (more than 0.1 s), which in leads V5–V6, I, aVL looks like rsR', RSR', RsR', rR' (the R wave predominates in the QRS complex). Depending on the width of the QRS complex, left bundle branch block can be complete or incomplete (incomplete LBBB: 0.1 s 15. Transthoracic cardioversion (EIT) Cardioversion may be accompanied by transient ST segment elevation. J. van Gelder et al. reported that in In 23 of 146 patients with atrial fibrillation or flutter after transthoracic cardioversion, ST segment elevation of more than 5 mm was determined, and there were no clinical or laboratory signs of myocardial necrosis. Normalization of the ST segment was observed on average within 1.5 minutes (from 10 s to 3 min.).However, patients with ST-segment elevation after cardioversion have a lower ejection fraction than patients without ST-segment elevation (27 and 35%, respectively).The mechanism of ST-segment elevation is not completely clear (Fig. 16).16. Wolff-Parkinson-White syndrome (WWS) WSWS - conduction of an impulse from the atria to the ventricles along the accessory bundle of Kent-Palladino, bypassing the normal conduction system of the heart. ECG criteria for WSWS: 1. Shortened PQ interval to 0.08–0.11 s. 2. D-wave – an additional wave at the beginning of the QRS complex, caused by the excitation of the “non-specialized” ventricular myocardium. The delta wave is directed upward if the R wave predominates in the QRS complex, and downward if the initial part of the QRS complex is negative (Q or S wave predominates), except for WPW syndrome, type C. 3. Bundle branch block (widening of the QRS complex more than 0.1 s). With WPW syndrome, type A is carried out by a pulse of atrial to the ventricles, it is carried out on the left beam of Kent - Palatino, for this reason the excitation of the left ventricle begins earlier than the right, and the blockade of the right leg of the GIS bundle is fixed on the ECG. With WPW syndrome, type B impulse from the atrial to the ventricles is drawn on the right bunch of Kent -Paladino. For this reason, the excitation of the right ventricle begins earlier than the left, and on the ECG the blockade of the left leg of the bundle of Gis is fixed. With WPW syndrome, type C, an impulse from the atrial to the side wall of the left ventricle goes along the left beam of Kent - Palatino, which leads to the excitation of the left ventricle earlier than the right, and on the ECG the blockade of the right leg of the Gis beam and a negative d - wave in V5– V6. 4. The tooth r is normal and duration. 5. The tendency to attacks of supraventricular tachyarrhythmia (Fig. 17). 17. The atrial flutter (TP) of TP is accelerated, superficial, but the correct rhythm of the reduction of atrial with a frequency of 220–350 per min. As a result of the presence of a pathological focus of excitement in atrial muscles. Due to the appearance of functional atrioventricular blockade, most often 2: 1 or 4: 1, the frequency of ventricular contractions is much less than the frequency of atrial contraction. ECG -criteria of the atrial flutter: 1. F -waves located in equal intervals, with a frequency of 220–350 per min., The same height, width and shape. The waves of F are well expressed in the leads of II, III, AVF, are often superimposed on the ST segment and imitate its elevation. 2. There are no isoelectric intervals - the waves of flutter form a continuous wave -like curve. 3. The typical shape of the waves f is “sawn -shaped”. The ascending knee is steep, and the descending one descends gradually hollow down and passes without an isoelectric interval into a steep ascending knee of the next wave F. 4. A partial AV blockade of varying degrees is almost always observed (more than 2: 1). 5. Complex QRS of the usual shape. Due to layering of waves F, ST interval and tooth T is deformed. 6. The R -R interval is the same with a constant degree of atrioventricular blockade (the correct form of the atrial flutter) and different - with the changing degree of AV blockade (the irregular form of flutter atrial) (Fig. 18). 18. Hypothermia (Osborne, GT syndrome) characteristic ECG -criteria GT are the occurrence of teeth in the area of the doughs of Osborne, elevation of the ST segment in the leads of II, III, AVF and left breast V3 - V6. Osborne’s teeth are directed in the same direction as the QRS complexes, while their height is directly proportional to the degree of GT. As the body temperature decreases, along with the described changes in ST - T, a slowdown in heart rate, lengthening of PR and QT intervals (the latter - mainly due to the ST segment) are revealed. As the body temperature decreases, the amplitude of the Osbourne tooth increases. At body temperature below 32 ° C, atrial fibrillation is possible, ventricular arrhythmias often occur. At body temperature 28-30 ° C, the risk of ventricular fibrillation increases (maximum risk at a temperature of 22 ° C). At body temperature 18 ° C and below, asystole occurs. GT is defined as a decrease in body temperature to 35 ° C (95 ° F) and below. It is customary to classify GT as light (at body temperature 34–35 ° C), moderate (30–34 ° C) and heavy (below 30 ° C) (Fig. 19). Thus, the Osborne tooth (hypothermic tooth) can be considered as a diagnostic criterion of pronounced central disorders. The amplitude of the Osbourne tooth was correlated back with a decrease in body temperature. According to our data, the severity of the Osbourne tooth and the value of the QT interval determine the prognosis. The lengthening of the QT C> 500 ms interval and the pronounced deformation of the QRST complex with the formation of the Osbourne tender significantly worsen life forecast. 19. Positional changes positional changes in the ventricular complex sometimes imitate the signs of them on the ECG. Positional changes differ from them by the absence of the dynamics of the ST and TT segment characteristic of the infarction, as well as a decrease in the depth of the Q to Zuber q during the registration of ECG at the height of inhalation or exhalation. The conclusion on the basis of the analysis of domestic and foreign literature, as well as my own data, I would like to emphasize that the elevation of the ST segment does not always reflect coronary pathology, and the practitioner often has to conduct differential diagnosis of many diseases, including rarely encountered.
Literature 1. Alpert D., Francis G. Treatment of myocardial infarction // Practical guide: Transl. from English – M.: Praktika, 1994. – 255 p. 2. Heart disease: A guide for doctors / Ed. R.G. Oganova, I.G. Fomina. – M.: Litterra, 2006. – 1328 p. 3. Dzhanashiya P.Kh., Kruglov V.A., Nazarenko V.A., Nikolenko S.A. Cardiomyopathies and myocarditis. – M., 2000. – P. 66–69. 4. Zhdanov G.G., Sokolov I.M., Shvarts Yu.G. Intensive therapy of acute myocardial infarction. Part 1 // Bulletin of intensive care. – 1996. – No. 4. – P.15–17. 5. Isakov I.I., Kushakovsky M.S., Zhuravleva N.B. Clinical electrocardiography. – L.: Medicine, 1984. 6. Clinical arrhythmology / Ed. prof. A.V. Ardasheva - M.: Publishing House "Medpraktika-M", 2009. - 1220 p. 7. Kushakovsky M.S. Cardiac arrhythmias. - St. Petersburg: Hippocrates, 1992. 8. Kushakovsky M.S., Zhuravleva N.B. Arrhythmias and heart block (atlas of electrocardiograms). – L.: Medicine, 1981. 9. Limankina I.N. On the issue of cerebrocardiac syndrome in mentally ill patients. Current issues in clinical and social psychiatry. – Ed. SZPD, 1999. – pp. 352–359. 10. Mravyan S.R., Fedorova S.I. ECG phenomenon of ST segment elevation, its causes and clinical significance // Clinical Medicine. – 2006. – T. 84, No. 5. – P. 12–18. 11. Orlov V.N. Guide to electrocardiography. – M.: Medical Information Agency, 1999. – 528 p. 12. Guide to electrocardiography / Ed. honorable activities sciences of the Russian Federation, prof. Zadionchenko V.S. – Saarbrucken, Germany. Publisher: LAP LAMBERT Academic Publishing GmbH&Co. KG, 2011. – P. 323. 13. Sedov V.M., Yashin S.M., Shubik Yu.V. Arrhythmogenic dysplasia/cardiopathy of the right ventricle // Bulletin of Arrhythmology. – 2000. – No. 20. – P. 23–30. 14. Topolyansky A.V., Talibov O.B. Emergency cardiology: Directory / Ed. ed. prof. A.L. Vertkina. – M.: MEDpress-inform, 2010. – 352 p. 15. Antzelevitch C., Brugada P., Brugada J. et al. Brugada syndrome: 1992–2002: a historical perspective // J Am Coll Cardiol 2003; 41:1665–1671. 16. Atarashi H., Ogawa S., Harumi K. et al. Characteristics of patients with right bundle branch block and ST–segment elevation in right precordial leads // Am J Cardiol 1996; 78:581–583. 17. Brugada R., Brugada J., Antzelevitch C. et al. Sodium channel blockers identify risk for sudden death in patients with ST–segment elevation and right bundle branch block but structurally normal hearts // Circulation 2000; 101:510–515. 18. Duclos F., Armenta J. Permanent Osborn wave in the absence of hypothermia // Rev Esp Cardiol 1972 Jul–Aug; Vol. 25 (4), pp. 379–82. 19. Durakovic Z.; Misigoj–Durakovic M.; Corovic N. Q–T and JT dispersion in the elderly with urban hypothermia // Int J Cardiol 2001 Sep–Oct; Vol. 80 (2–3), pp. 221–6. 20. Eagle K. Osborn waves of hypothermia // N Engl J Med 1994; 10: 680. 21. Fazekas T., Liszkai G., Rudas LV Electrocardiographic Osborn wave in hypothermia. // Orv Hetil 2000 Oct 22; Vol. 141(43), pp. 2347–51. 22. Gussak I., Bjerregaard P., Egan TM, Chaitman BR ECG phenomenon called the J wave: history, pathophysiology, and clinical significance // J Electrocardiol 1995; 28:49–58. 23. Heckmann JG, Lang CJ, Neundorfer B. et al. Should stroke caregivers recognize the J wave (Osborn wave)? // Stroke 2001 Jul; Vol. 32 (7), pp. 1692–4. 24. Igual M., Eichhorn P. Osborn wave in hypothermia // Schweiz Med Wochenschr 1999 Feb 13; Vol. 129(6), pp. 241. 25. Kalla H., Yan GX, Marinchak R. Ventricular fibrillation in a patient with prominent J (Osborn) waves and ST segment elevation in the inferior electrocardiographic leads: a Brugada syndrome variant? // J Cardiovasc Electrophysiol 2000; 11:95–98. 26. Osborn JJ Experimental hypothermia: Respiratory and blood pH changes in relation to cardiac function // Am J Physiol 1953; 175:389–398. 27. Otero J., Lenihayn DJ The normothermic Osborn wave induced by severe hypercalcemia // Tex Heart Inst J 2000; Vol. 27 (3), pp. 316–7. 28. Sridharan MR, Horan LG Electrocardiographic J wave of hypercalcemia // Am J Cardiol. 29. Strohmer B., Pichler M. Atrial fibrillation and prominent J (Osborn) waves in critical hypothermia // Int J Cardiol 2004 Aug; Vol. 96(2), pp. 291–3. 30. Yan GX, Lankipalli RS, Burke JF et al. Ventricular repolarization components on the electrocardiogram: Cellular basis and clinical significance // J Am Coll Cardiol 2003; 42:401–409.