Sokolov-Lyon Index (SLI)
Sokolov-Lyon index (SLI) = SV1 (mm) + RV5 (mm) or RV6 (mm).
Normal: up to 48 mm in persons under 40 years of age and up to 38 mm in persons over 40 years of age
To determine this index, it is necessary to add the amplitude (depth) of the SV1 tooth to the amplitude (height) of RV5 or RV6. The resulting figure, expressed in millimeters, will be the index.
Cornell voltage product (CVP)
Cornell voltage product (CVP) = [RaVL(mm) + SV3 (mm)] × QRS (ms)
Normal: less than 2440 mm/ms.
The Cornell voltage product is calculated a little more complicated: it is necessary to multiply the duration of the QRS complex, expressed in milliseconds, by the sum of R -aVL (mm) + S -V3 (mm). The difficulty is that you have to multiply large numbers and you can’t do it without a calculator. If the obtained value exceeds 2440, then we are talking about LVMH.
OTHER CRITERIA
RV4 < RV5 > RV6 or RV4 < RV5 < RV6 - shift of the transition zone to the left
Now we will discuss the criterion of LVMH determined by the dynamics of the R wave in the precordial leads. The fact is that in non-hypertrophied myocardium the total excitation vector is directed to the apex, therefore the highest R wave will be recorded in lead V4. In the case of hypertrophy, (but not always) the vector shifts to the left, partly due to thickening of the lateral wall of the left ventricle, and partly due to changes in the boundaries of the heart. Because of this, the maximum R begins to be determined not in V4, as is normal, but in lead V5 or V6.
Many “old school” cardiologists consider this sign to be the most important, however, this is not so. The reason lies in the fact that cardiologists are accustomed to seeing mostly sick people who have hypertrophy in 80%-90%, but if they examine the entire population, then an erroneous conclusion about LVMH will be given to every second patient with such changes on the ECG. So, be careful with this criterion, although it has greater sensitivity than the above indices (ISL and KVP), but its specificity is no more than 60%, while for the above indices it approaches 100%.
ECG sign of Sokolov Lyon what is it
It is very common to see electrocardiograms, changes in which were interpreted as left ventricular myocardial hypertrophy (LVMH).
But looking at the record more carefully, it most often turns out that there are no criteria for LVMH as such. Let's be clear right away. Currently, in generally accepted recommendations, both domestic and foreign, there are only two criteria by which, looking at the ECG, we have the right to talk about LVMH. Please note, it is presence, not absence!
We are talking about the Sokolov-Lyon index (ISL) and the Cornell voltage product (CVP), the formulas for their calculation are given below.
Sokolov-Lyon index (SLI) = SV1 (mm) + RV5 (mm) or RV6 (mm). Cornell voltage product (CVP) = [ RaVL(mm) + SV3 (mm) ? QRS (ms)]
We can talk about hypertrophy only in cases where the Sokolov-Lyon Index exceeds 38 mm in patients over 40 years of age and more than 48 mm in young people, or the CVP is more than 2440 mm•sec.
But there is one problem, although these two methods have a specificity approaching 100%, their sensitivity is very low and is only 22% and 42% respectively.
Simply put, 100% of patients with a cardiogram that meets the criteria have LVMH, whereas in the absence of these criteria, hypertrophy cannot be excluded!
Here the presence of LVMH is beyond doubt - ISL = 39 mm. At the same time, using another KVP criterion (in this case it is equal to 540 mm*ms), we are convinced of its low sensitivity.
• As a rule, a left-type ECG is recorded, in which the R wave in lead I is high, and the S wave in lead III is deep. Along with these changes, which usually appear on the left-type ECG, depression of the ST segment and a negative T wave in lead I are also noted.
• Important changes are noted in chest leads V5 and V6. In these leads, a high R wave is recorded, the ST segment is sometimes reduced, and the T wave is negative. These are important signs of LV hypertrophy.
• In leads V1 and V2, on the contrary, a deep S wave is recorded.
• Signs of LV hypertrophy are often observed with mitral regurgitation, aortic valve defects and arterial hypertension (AH).
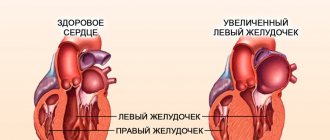
Due to physiological characteristics, the thickness of the left ventricular (LV) myocardium is normally greater than the RV. With LV hypertrophy, the main vector of the EMF is directed to the left and backward and, depending on the degree of hypertrophy, is more or less pronounced, and sometimes turns downward. The main vector of the EMF increases due to an increase in the muscle mass of the ventricle.
To diagnose left ventricular (LV) hypertrophy, you must first review the ECG recorded in the limb leads and determine its type. Then you should look for deviations from the normal shape of the curve. Next, they look at the ECG taken in the chest leads and look, as in the case of analyzing the ECG in the limb leads, for changes indicating LV hypertrophy.
The ECG in the limb leads (in the frontal plane) is of the left type, since the main EMF vector is directed to the left. Therefore, in lead 1 the R wave is high, and in lead 3 the S wave is deep.
Next, pay attention to the fact that with a normal left type of ECG, the T wave in lead I is positive, while with LV hypertrophy, on the contrary, it is negative.
In addition, ST segment depression is also noted.
Vectorogram of the heart in the horizontal plane in normal conditions and with left ventricular (LV) hypertrophy. Left: Normal small QRS vector loop directed to the left. Normal R and T waves in leads V1 and V6.
Right: The large vector loop of the QRS complex is directed to the left and backward. The T-loop faces in the opposite direction to the loop of the QRS complex and is discordant with it.
High R wave and negative T wave with ST segment depression in lead V6.
Deep S wave in lead V1.
If there is a high R wave, ST segment depression and a negative T wave in lead I, then left ventricular (LV) hypertrophy can be reasonably suspected.
When analyzing an ECG taken in Goldberger leads, changes similar to those described above are often detected in lead aVL, since this lead is directed to the left ventricle (LV) and reflects its potential. This means that a high R wave, ST segment depression and a negative T wave are recorded in lead aVL.
In the chest leads, there is an increase in the potential in V5 and V6, where a high R wave is recorded, due to an increase in LV muscle mass. Due to myocardial hypertrophy, the time of propagation of excitation through the ventricles (the width of the QRS complex) is increased and the VVO is slightly lengthened (>0.052 s), but usually there is no blockade of LBP.
The greater the LV hypertrophy, the higher the R wave in leads V5 and V6, i.e. R wave height is greater than 2.6 mV or 26 mm. In severe LV hypertrophy, restoration of myocardial excitability (repolarization) is also impaired.
Therefore, ST segment depression and a negative T wave are also observed in leads V5 and V6, especially with pressure overload (for example, with aortic stenosis).
Since the main vector is strongly deviated to the left, it is directed away from the RV (i.e., away from lead V1). Therefore, negative is recorded in leads V1 and V2, i.e. deep S wave.
If the sum of the amplitude of the R wave in leads V5 or V6 and the S wave in leads V1 and V2 exceeds 35 mm, then we speak of a positive Sokolov-Lyon index. This indicator allows you to judge whether the patient has LV hypertrophy. However, it should be remembered that in athletes, and also sometimes in people with a practically healthy heart, the Sokolov-Lyon index turns out to be false positive.
With severe left ventricular (LV) hypertrophy, secondary LA enlargement may occur. Therefore, in patients with severe left ventricular (LV) hypertrophy, the left atrial P wave may also be recorded on the ECG.
Signs of left ventricular (LV) hypertrophy are found with heart defects, in particular mitral and aortic regurgitation or with hypertension and dilated cardiomyopathy.
ECG signs of left ventricular hypertrophy
a) Limb leads: • Left ECG type • RI + S III >2.5 mV, RI > RII > RIII and TI 1.1 mV
• Left atrial P wave
Source: https://serdce-moe.ru/obsledovaniya/ekg/ekg-priznak-sokolova-lajona-chto-eto
SYSTOLIC OVERLOAD OF THE LEFT VENTRICLE
A separate concept in the LVMH section is “systolic overload of the left ventricle.” It must be said that in fact, the ventricle does not experience any special overload either at the time of ECG recording or during any other period of time, except for that which is associated with high blood pressure. There are situations when a person with blood pressure is 150/90 mm Hg. we see “systolic overload”, but in others, even with a pressure of 220/120 mm Hg, there is no hint of such changes. In addition, normalization of blood pressure never led to the disappearance of “overload”.
Systolic overload as an ECG phenomenon occurs in the case of severe hypertrophy, which leads to disruption of the repolarization wave, but we will not go into details, the main thing is that you understand the meaning of this term and do not confuse hemodynamics with electrical activity.
Yes, so how does this “phenomenon” manifest itself? And it manifests itself in the form of disturbances in the repolarization processes of a very specific type (see further on the ECG), occurring in the area of the lateral wall of the left ventricle, always in combination with high R waves or, more often, in combination with positive criteria for LVMH (ISL or CVP).
In conclusion, it is worth noting that in my (and not only my) opinion, in the presence of positive criteria for ISL and CVP, we need to talk about quantitative signs of hypertrophy, while a shift of the transition zone to the left should be called qualitative signs of hypertrophy.
Left ventricular hypertrophy is a cardiovascular risk factor
Left ventricular hypertrophy (LVH) is a strong predictor of cardiovascular morbidity and all-cause mortality in patients with hypertension.
Antihypertensive treatment that reverses LVH reduces the incidence of cardiovascular events and improves survival, regardless of how much blood pressure (BP) levels decrease.
It is clinically important to recognize that LVH is a risk factor that is modifiable, and the correction of this factor is more comprehensive than simply controlling blood pressure.
This article reviews the definition of LVH, compares the diagnostic tests that can detect it, and discusses the current evidence-based approach to correcting this dangerous risk factor.
LVH is caused by chronically increased workload on the heart
Left ventricular hypertrophy is a pathological increase in left ventricular myocardial mass caused by chronically increased workload of the heart. LVH most often occurs because the heart pumps against increased resistance, as occurs with hypertension and aortic stenosis.
Another common cause of LVH is increased left ventricular filling (called diastolic overload), which occurs in patients with aortic or mitral regurgitation and dilated cardiomyopathy. Coronary artery disease may also play a role in the pathogenesis of LVH, and the mechanism is an attempt by normal myocardium to compensate for weakened or deficient systolic function in ischemic or infarcted tissues.
A key component in the development of LVH is myocardial fibrosis (Figure 1), which compromises cardiac function. Fibrosis initially manifests as diastolic dysfunction, although systolic dysfunction may occur as the disease progresses.
There is evidence that the development of myocardial fibrosis is pathophysiologically related to the renin-angiotensin-aldosterone system.
There is evidence that angiotensin II has a profibrotic effect on the myocardium of patients with hypertension.
This may explain why angiotensin-converting enzyme (ACE) inhibitors and angiotensin II receptor blockers (ARBs) are the most potent drugs for reversing left ventricular hypertrophy.
Genetics also plays an important role in the pathogenesis of LVH. Mutations in genes encoding sarcomeric proteins have been identified in patients with hypertrophic cardiomyopathy. In addition, it appears that there is a genetic predisposition to the occurrence of LVH, so that some patients with mild hypertension develop myocardial hypertrophy, while others do not.
Diagnosis of left ventricular hypertrophy using ECG
This ECG was obtained from a 62-year-old woman with long-standing hypertension. ECG shows left ventricular hypertrophy
ECG is the cheapest and most accessible of the three methods for diagnosing LVH. Although the specificity of this method is quite high, its clinical usefulness is limited by very low sensitivity.
Over the years, many different criteria for diagnosing LVH using ECG have been proposed. Most of these criteria use voltage at one or more leads with or without additional factors such as QRS duration, secondary ST-T changes, or evidence of left atrial hypertrophy.
Common electrocardiographic criteria for diagnosing left ventricular hypertrophy (LVH)
Cornell Voltage Criteria
Sokolov-Lyon voltage criteria
or Romgil-Estes Scoring System A score of ≥5 is diagnostic for LVH, a score of 4 indicates “probable” LVH Voltage criteria (3 points): |
- Any S or R wave in the limb leads ≥20 mm
- SV 1, SV 2, RV 5 or RV 6 ≥30 mm
ST-T changes typical of LVH
- (3 points; 1 point if patient receives cardiac glycoside)
Signs of left atrial hypertrophy (3 points):
- The depth of the terminal component of the P wave in lead V1 is ≥1 mm and its duration is ≥40 ms (≥1 mm if the tape speed is 25 mm/s and ≥2 mm if the tape speed is 50 mm/s)
Deviation of the electrical axis of the heart to the left (2 points):
- EMU is deflected to the left to -30 degrees or more negative
Prolonged QRS duration (1 point): ≥90 ms Delayed internal deviation time (1 point):
- ≥50 ms at tap V 5 or V 6
A systematic review of 21 studies that was published in 2007 found that all of these criteria were significantly less sensitive than specific:
- Cornell voltage test—median sensitivity 15%, median specificity 96%;
- Sokolov-Lyon index—median sensitivity 21%, median specificity 89%;
- Romgilt-Estes scoring system—median sensitivity 17%, median specificity 95%.
It should be noted that the ranges of published indicators were extremely wide.
ECG is an insensitive method for diagnosing LVH because it relies on measuring the electrical activity of the heart using electrodes on the surface of the skin, and from the measurements of electrical activity an assumption about the mass of the left ventricle is made.
Measuring intracardiac electrical activity using external electrodes is problematic because the measurements are influenced by everything between the myocardium and the electrodes, with fat, fluid, and air having the greatest influence.
As a result, ECG is an insensitive method for diagnosing LVH in obese patients with pleural effusion, pericardial effusion, anasarca, or chronic obstructive pulmonary disease.
In addition, the diagnosis of LVH by ECG is highly influenced by age and ethnicity.
Although ECG is not sensitive and cannot be used to rule out LVH, it still plays a role in the diagnosis and treatment of patients.
In the landmark LIFE study, regression of left ventricular hypertrophy (diagnosed using ECG criteria) in response to treatment with losartan resulted in improved cardiovascular outcomes, independent of BP levels.
Therefore, it is reasonable to recommend that all patients with hypertension and other patients at risk of developing LVH undergo an ECG and apply the described criteria for assessing LVH.
Echocardiography is the method of choice
If an echocardiograph is available, then echocardiography should be the method of choice for diagnosing LVH. This test is much more sensitive than an ECG and can detect other abnormalities such as left ventricular dysfunction and heart valve disease.
Transthoracic echocardiography (rather than transesophageal echocardiography) is preferably used and measures the end-diastolic diameter (size) of the left ventricle, the thickness of the posterior wall of the left ventricle, and the thickness of the interventricular septum. From these three measurements, as well as the patient's height and weight, the left ventricular mass index can be calculated.
Several different cutoff values for left ventricular mass index have been proposed to establish left ventricular hypertrophy; in the LIFE study, index values of >104 g/m2 in women and >116 g/m2 in men were used to diagnose LVH.
Images from an echocardiographic study performed on a 68-year-old patient who had uncontrolled hypertension and symptoms of congestive heart failure.
If echocardiography is used to diagnose LVH, it is important that the left ventricular mass index is used for this purpose, and not just the thickness of the left ventricular posterior wall and interventricular septum (as is often the case in clinical practice).
This is important because left ventricular wall thickness alone is not a good indicator of LVH; the concordance rate between wall thickness and left ventricular mass index is only 60%. In addition, when analyzing left ventricular wall thickness, there is a tendency to underestimate LVH in women and overestimate it in men.
Cardiac MRI: the very expensive gold standard
The MRI image of the heart shows concentric hypertrophy of the left ventricle. This study was performed in a 65-year-old man who was suspected of having infiltrative myocardial disease.
Cardiac MRI is the gold standard for diagnosing LVH because it is even more accurate and reproducible than echocardiography.
It can accurately assess a patient's left ventricular mass and diagnose other structural abnormalities of the heart.
However, this method has very serious limitations in clinical practice due to the very high cost and limited availability of equipment. Cardiac MRI is primarily used in clinical studies and to evaluate cardiac anatomy in certain clinical situations.
Antihypertensive treatment should include an ACE inhibitor or ARB
Once LVH has been diagnosed, the next step is to decide what the optimal treatment is for the patient.
Although the choice of treatment will always depend on other comorbid conditions, a 2003 meta-analysis that assessed the effectiveness of various antihypertensive medications on regression of LVH found that ARBs were the most effective class of drugs for reducing left ventricular mass. Specifically, ARBs reduced left ventricular mass by 13%, followed by calcium channel blockers (11%), ACE inhibitors (10%), diuretics (8%), and beta blockers (6%).
As already mentioned, there is evidence that LVH is pathophysiologically associated with myocardial fibrosis and the renin-angiotensin-aldosterone system.
It is for this reason, and based on the data presented previously regarding the degree of regression of LVH, that ACE inhibitors and ARBs should be used as first-line drugs to reduce LVH, unless they are contraindicated in a particular patient.
The results of clinical trials (especially the LIFE study) suggest that it may be advisable not only to treat LVH, but also to monitor the reduction of left ventricular mass index as a treatment goal (similar to how glycosylated hemoglobin is used in patients with diabetes). If left ventricular mass index is monitored in this way, it is potentially possible to adjust the dose of prescribed drugs, change classes of drugs, or add another drug if LVH persists. In this way, the patient's overall cardiovascular risk can be optimized.
Let's summarize:
- LVH is a common risk factor that is potentially modifiable but has received very little attention in clinical practice.
- Ideally, all patients with hypertension should be screened using echocardiography to identify potential LVH; To diagnose LVH, it is necessary to use the calculated left ventricular mass index, and not just indicators of the thickness of the walls of the left ventricle.
- ECG is a specific method for diagnosing LVH and also has prognostic value; this method is not sensitive enough to be used only for screening LVH.
- Once a diagnosis of LVH is made, the initial treatment regimen should include an ARB or an ACE inhibitor. Response to treatment can be assessed by monitoring the decrease in left ventricular mass index or regression of electrocardiographic signs of LVH.
- Treatment-induced regression of LVH reduces the incidence of cardiovascular complications and improves overall patient survival. When prescribing treatment for patients with hypertension, it is important to remember that correction of LVH is not synonymous with blood pressure control.
Source: https://www.eskulap.top/terapija/gipertrofija-levogo-zheludochka-serdechno-sosudistyj-faktor-riska/
Limitations of criteria, IMPORTANT! IMPORTANT! IMPORTANT!
1. In the presence of complete or incomplete blockade of the left leg, the criteria do NOT work!
2. In the presence of complete blockade of the right leg, the criteria do NOT work!
3. If there are scar changes, the criteria do NOT work!
4. If the criteria are negative, this does NOT mean that there is no hypertrophy! Low sensitivity.
Determining LVMH despite points 1-3 is a gross mistake, which is nevertheless very common even among cardiologists!
Well, let's see how it all looks.
1.3. ARTERIAL HYPERTENSION
Additional research methods
Evaluation of organ damage due to hypertension
| Screening tests to detect organ damage caused by hypertension | Indications and interpretation |
| ECG in 12 leads | Screening to detect left ventricular hypertrophy and other possible abnormalities, as well as to document heart rhythm and detect arrhythmias |
| Albumin:creatinine ratio in urine | To detect increased albumin excretion, which indicates possible kidney damage |
| Blood creatinine and GFR | To detect kidney damage |
| Fundoscopy | To detect hypertensive retinopathy, especially in patients with stage 2 or 3 hypertension |
| A more detailed examination of organ damage caused by hypertension | |
| EchoCG | To assess the structure and function of the heart, if this information may influence the choice of treatment strategy |
| Ultrasound | To detect the presence of atherosclerotic plaques or stenoses of the carotid arteries, especially in patients with cerebrovascular disease or signs of vascular disease in other locations |
| Ultrasound and Doppler examination of the abdominal cavity | To assess the size and structure of the kidneys (for example, scar changes) and exclude obstructive lesions of the urinary tract as a cause of CKD and hypertension, assess the condition of the abdominal aorta, exclude aneurysm and vascular lesions. Examine the adrenal glands to exclude an adenoma or pheochromocytoma (CT or magnetic resonance imaging is preferable for a thorough examination). Doppler examination of the renal arteries to exclude renovascular diseases, especially when identifying asymmetry in kidney size |
| Pulse wave speed | Indicator of aortic stiffness and arteriosclerosis |
| Ankle-brachial index | Screening for atherosclerosis of the lower extremities |
| Cognitive assessment | To assess cognitive functions in patients with signs of impairment |
| Brain Imaging | To evaluate for the presence of ischemic or hemorrhagic brain injury, especially in patients with a history of cerebrovascular disease or signs of cognitive decline |
Most commonly used simple criteria and cut-off values for detecting left ventricular hypertrophy (LVH) using ECG
| Voltage ECG criteria | Criteria for LVH |
| S v1 + R v5 (Sokolov-Lyon criterion) | >35 mm |
| R wave amplitude in lead aVL | ≥11 mm |
| R aVL + S V3 (Cornell voltage index), i.e. total voltage of limb and chest leads | >28 mm (men), >20 mm (women) |
| Cornell product = × QRS duration (ms) | >2440 mm×ms |
Sokolov-Lyon criterion (index)
Sokolov-Lyon criterion = S V1 (mm) + R V5 (mm) or R V6 (mm).
Norm: up to 35 mm.
To determine this index, it is necessary to add the amplitude (depth) of the S V1 wave to the amplitude (height) of R V5 or R V6. The resulting figure, expressed in millimeters, will be the index.
Cornell voltage product
Cornell voltage product = [R aVL(mm) + S V3 (mm)] × QRS (ms).
Normal: less than 2440 mm/ms.
The Cornell voltage product is calculated a little more complicated: it is necessary to multiply the duration of the QRS complex, expressed in milliseconds, by the sum of RaVL (mm) + SV3 (mm).
1. In the presence of complete or incomplete blockade of the left leg, the criteria do NOT work!
2. In the presence of complete blockade of the right leg, the criteria do NOT work!
3. If there are scar changes, the criteria do NOT work!
4. If the criteria are negative, this does NOT mean that there is no hypertrophy! Low sensitivity.
EXAMPLE 1
On this ECG you can see almost all the criteria for left ventricular myocardial hypertrophy (LVMH).
1. Sokolov-Lyon index (ISL) = SV1 (19 mm) + RV5 (22 mm) = 41 mm (norm up to 38 mm)
2. Cornell voltage product (CVP) = [RaVL(13 mm) + SV3 (10 mm)] × QRS (100 ms) = 2300 ms*mm (the norm is up to 2440, this negative criterion was slightly missed)
3. Transition zone offset - RV4 < RV5 < RV6.
4. Systolic overload - we see ST depression in V5 and V6 and biphasic, predominantly negative, T, that is, a violation of repolarization processes.