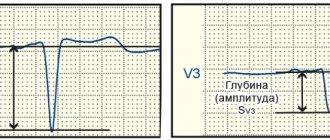
ECG (electrocardiogram) is a universal examination method that helps to identify a wide range of diseases of various types. However, the resulting graph is largely a mystery to the patient. What do negative T waves mean here, for example? Only your attending doctor will give you a complete, comprehensive answer specifically for your case. Indeed, when reading a cardiogram, not only certain knowledge is important, but also extensive work experience. In this material we will present to the reader important basic indicators, their norm, and estimated deviation values.
What it is?
This is where we will begin preparing for the ECG interpretation. The T wave is the most important indicator on the electrocardiogram, which can help the doctor make a conclusion about the recovery process after contraction of the heart ventricles. He is the most changeable in the schedule.
By its shape and location, one can judge the amplitude of heart contractions, the presence of such dangerous diseases, conditions and pathologies as myocardial damage, endocrine diseases, intoxication of the body, taking incorrectly selected medications, etc.
Let's take a closer look at deciphering the ECG and the norm for this indicator.
What is a T wave, the norm and causes of deviation
ECG is based on recording electrical impulses generated by the heart.
With an ECG, the work of the heart is reflected on paper in the form of a graph. It has various teeth and straight lines corresponding to the phase of the heart muscle. The T wave is normally always positive; it is part of the ST region and indicates the beginning of repolarization, that is, after contraction, the heart muscle begins to come to rest and recover. Any disturbances in the location of this tooth indicate that the restorative functions of the heart are impaired.
It is difficult to decipher an electrocardiogram on your own. As a rule, the presence of negative T waves indicates that the myocardial tissue is damaged and cannot fully recover after excitation.
This condition occurs with the following ailments:
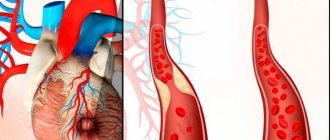
- Heart attack. In most cases, a negative T wave indicates ischemic disease and an incipient heart attack. As a result of ischemia or atherosclerosis, blockage of the heart vessels occurs, resulting in necrosis of part of the myocardium. This is dangerous because the contractility of the heart decreases, which can lead to dangerous consequences, including death.
- Angina pectoris. Angina is considered a symptom of coronary artery disease and a pre-infarction condition. It is accompanied by severe and sharp pain in the chest due to insufficient oxygen saturation of the myocardium. Physical activity and stress can be a provoking factor.
- Hormonal disorders. Endocrine diseases, diabetes mellitus, diseases of the pituitary gland or adrenal glands can cause disturbances in the functioning of the heart. Hormonal imbalance negatively affects the functioning of the cardiovascular system.
- Pulmonary heart. Pulmonary heart is a pathology accompanied by an enlargement of the right atrium and ventricle due to disruption of the bronchi and lungs. This disease often develops in people with chronic pulmonary diseases. The causes of the development of cor pulmonale can be bronchitis, bronchial asthma, tuberculosis, pneumonecrosis, and emphysema.
The appearance of negative T waves on the cardiogram can be provoked by cerebral circulatory disorders and taking certain medications: for arrhythmia, antidepressants. It is not always possible to make a diagnosis based on one ECG; further examination and clarification of the diagnosis are required.
Clinical manifestations
The clinical picture largely depends on what specific disease led to the appearance of a negative T wave. Different heart diseases may manifest themselves differently or have similar symptoms.
However, it is worth remembering that clinical manifestations do not always occur quickly. An ECG may detect a negative T wave, but the patient will feel fine, unaware of the onset of the disease. For this reason, it is recommended to undergo the procedure every year.
In diseases that lead to a negative T wave on the cardiogram, the following symptoms may appear:
| Chest pain | Many heart ailments are accompanied by discomfort in the chest area. This can be a sharp and strong pressing sensation, as with angina, or a slight tingling, pain radiating to the left arm and lower back. In any case, the occurrence of heart pain is an alarming sign that requires examination and treatment. |
| Dyspnea | Shortness of breath is a particular companion to heart disease. Due to poor heart function, blood circulation in all organs, including the lungs, is disrupted. Shortness of breath can occur with minimal physical activity, as well as as a result of severe stress. In the later stages, shortness of breath is constant and appears even at rest. |
| Increased fatigue, tiredness | People with heart disease are prone to causeless fatigue, fatigue, difficulty coping with stress, and feel drowsiness and lethargy. |
| Tachycardia | Rapid heartbeat is an unpleasant symptom that appears with various heart ailments. Severe tachycardia is felt strongly, leads to shortness of breath, deterioration of well-being and can be life-threatening. |
| Heart cough | It does not occur at the initial stage of heart disease, but at later stages. The appearance of a dry cough, especially at night, when the patient is in a horizontal position for a long time, is associated with impaired blood circulation in the lungs. The heart cannot pump blood sufficiently, and the lung tissue begins to suffer from a lack of nutrients and oxygen. |
Symptoms may concern not only cardiac manifestations. With hormonal imbalances, disturbances affect any organs and tissues; weight problems, headaches, feelings of heat or cold, etc. may occur. Only a doctor can reliably determine the diagnosis after a thorough examination.
Normal values for adults
On the graph, this tooth coincides with the so-called repolarization phase, that is, with the reverse transition of potassium and magnesium ions through the membrane of cardiac cells. It is after this that the muscle fiber cells will be ready for the next contraction.
Now deciphering the ECG. Normal for adults:
- Along the isoline, the T will begin after the S wave.
- The direction should visually coincide with the QRS. That is, to be positive where R predominates, negative in areas where S is already dominant.
- The normal tooth shape is smooth. Its first part will be flatter.
- The amplitude reaches the 8th cell.
- The ECG leads increase from 1 to 3.
- The wave is negative in V1 and aVL.
- Always negative T in aVR.
T wave value
T waves correspond to the onset of repolarization after muscular excitation of the ventricles (contraction), which corresponds to the return of sodium and potassium ions across the cell membranes in preparation for the next depolarization. The T wave originates from the isoline (from the end of the ST segment). Its normal values correspond to:
- non-jagged (smooth) and positive indicators (above the isoline),
- flatness at the initial stage,
- coincidence of the direction of the electrical axis with the QRS complex (normally sixty-degree deviations are allowed), that is, the predominance of R corresponds to the positive direction of the T wave, and the dominance of S – to the negative,
- an increase in the amplitude of the T wave in the precordial leads from the first to the third (acceptable size is from three to eight cells along the axis), while the negative polarity for this gap is atypical,
- possibility of negative polarity and smoothness in V1 and mandatory negative value in AVR,
- obligatory positivity in I and II, possible positivity in AVL and AVF (the graph can be smoothed or two-phase),
- permissible negativity in AVL and mandatory - in lead III,
- exceeding indicators in lead I compared to lead III,
- higher levels in lead V6 compared to lead V1.
Thus, a change in the T wave on the ECG indicates a violation of the restorative function of the cardiac ventricles after contraction. But it can also be influenced by other factors. The true causes of such cardiac dysfunction can be determined by the amplitude, size (along the axis) and polarity of the T wave.
Norms for newborns and children
Features of deciphering an ECG (we presented the norm for adults above) for newborns:
- In this case, normal T waves are low or even completely flat.
- The directions will be directly opposite to adults. What is this connected with? The baby's heart turns in the direction - it occupies its constant physiological position only for 2-4 weeks of life.
Now let's list the features of the children's ECG - older children:
- Normally, negative T in V4 can persist for up to 10 years, and in V2 and 3 for up to 15 years.
- Both in adolescents and in older young people, negative T wavelengths in the first and second chest leads of the ECG are acceptable. By the way, this type is called juvenile.
- The T height will gradually increase from 1 to 5 mm. For example, for schoolchildren it is approximately 3-7 mm. And these are indicators comparable to adults.
P wave on ECG
Rhythmogram of lead II with normal P waves. The P wave displays the process of atrial depolarization.
It is the key to determining the heart rhythm, so it is very important to learn how to find it on an ECG. If the heart rhythm is sinus, as it should be normally, then the P wave should meet the following criteria:
- It is always positive in leads II and aVF.
- It is always negative in lead aVR
Besides:
- The duration (width) of the P wave is no more than 0.1-0.12 s.
- The amplitude (height) of the P wave is 1.5-2.5 mm
Where and how to look for the P wave on an ECG
It is best to look for it in leads II or V1. First, find an isoline, which is a relatively long section of the ECG without waves (straight line) . Normally, the first wave appearing after the isoline will be the P wave.
Rhythmogram of lead II with normal P waves
What can the P wave be confused with?
In theory, everything seems simple. But there are several conditions in which the P wave can be confused with something else. Let's look at the main problem situations.
You see P waves, but their polarity is not what it should be normally.
Junctional rhythm
The P wave should be positive in leads II, aVF, but on the ECG above it is negative. This is not sinus P, it is a junctional rhythm (a type of supraventricular rhythm). You can read more about this rhythm disorder in the corresponding section of the site.
You see two, three or more P-shaped teeth following each other.
Atrial flutter
If you see a similar phenomenon, then you need to think that these waves are not P waves, since this is a whole wave and it has a special name - F waves. This is atrial flutter.
There may be another situation here, for example, AV block, when there are normal P waves following one after another, since not each of them is conducted through the AV node.
You see what looks like P waves, but they are very fuzzy and don't look alike
Look at this ECG. It seems like there are some waves here and there that could pass for a P wave, doesn't it?
Slurred P waves*
But if you can't find two identical waves at the same distance from the ventricular complex in consecutive cardiac cycles (QRST), then they are not P waves! And if the heart rate is not rhythmic, as in the above ECG, then you should immediately think about atrial fibrillation (atrial fibrillation). It is this rhythm disturbance that is represented on this tape.
In general, we have analyzed the most common problems encountered when searching and identifying P waves on an ECG. But the more you work with the ECG, the faster you will see that the problem with the P wave remains relevant even for experienced specialists. Sometimes, just from one ECG tape it is not possible to understand what we are dealing with. But no matter what, you still need to start your journey with simple things that we talked about earlier.
If you want to practice a little, and not only on the topic of the P wave, then there are more than 100 ECG tasks at your disposal in the form of tests. The link is located in the main menu of the site.
If you find any error, please select a piece of text and press “ Ctrl+Enter”
What do the changes mean?
Let's take a closer look at the reasons for a negative T wave on an ECG. In general, an electrocardiogram helps diagnose the following diseases:
- Osteochondrosis.
- Poor circulation in certain areas of the brain.
- General potassium deficiency.
- Diseases of endocrine nature.
- Cardiopsychoneurosis.
- Constant stress, severe nervous overload.
- Various types of intoxication of the body. Including nicotine, glycosides, aminazine, antiarrhythmic drugs.
- Hypertrophy of the cardiac ventricles.
- Injuries, infections and tumors of various nature.
- Pericarditis.
- Thromboembolism.
- Myocarditis, etc.
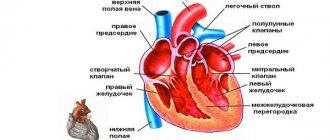
Brief description of ECG elements
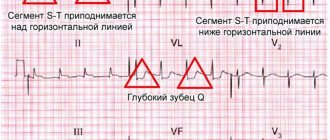
In the graphic image, time is recorded horizontally, and frequency and depth of changes are recorded vertically. Sharp angles displayed above (positive) and below (negative) from the horizontal line are called serrations. Each of them is an indicator of the condition of one or another part of the heart.
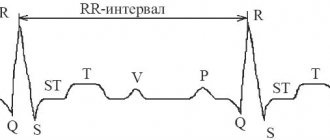
On the cardiogram, the waves are designated as P, Q, R, S, T, U.
- the T wave on the ECG reflects the recovery phase of the muscle tissue of the heart ventricles between myocardial contractions;
- wave P – indicator of depolarization (excitation) of the atria;
- teeth Q, R, S reflect the excited state of the ventricles of the heart;
- The U-wave determines the recovery cycle of distant areas of the cardiac ventricles.
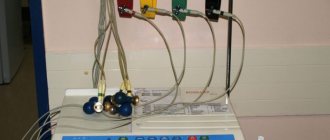
The range between adjacent teeth is called a segment; there are three of them: ST, QRST, TP. The tooth and the segment together represent the interval - the time it takes for the impulse to pass. For accurate diagnosis, the difference in indicators of the electrodes (electric potential of the lead) attached to the patient’s body is analyzed. Leads are divided into the following groups:
- standard. I – difference in indicators on the left and right hand, II – ratio of potentials on the right hand and left leg, III – left hand and leg;
- reinforced. AVR – from the right hand, AVL – from the left hand, AVF – from the left leg;
- chest Six leads (V1, V2, V3, V4, V5, V6) located on the chest of the subject, between the ribs.
A qualified cardiologist interprets the results of the study.
Having received a schematic picture of the work of the heart, the cardiologist analyzes the changes in all indicators, as well as the time for which the cardiogram records them. The main data for decoding are the regularity of muscle contractions of the heart, the number (number) of heart contractions, the width and shape of the waves reflecting the excited state of the heart (Q, R, S), the characteristics of the P wave, the parameters of the T wave and segments.
Main deviations
Negative T waves are just one type of deviation of this electrocardiogram indicator from the norm. But there is a whole list of them - each name will talk about its own violation.
The main ones will be:
- Negative T waves.
- Two-phase.
- Flat.
- Smoothed.
- Inversion.
- Coronary.
- Depression.
- Decreased performance.
- Raising the tooth.
- High performance.
We will provide an explanation of a number of deviations in the following sections of the article.
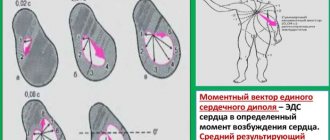
ECG. Left atrial hypertrophy
With hypertrophy of the left atrium, the EMF it creates increases, while the excitation of the right atrium occurs normally.
The top picture shows the formation of a normal P wave:
- excitation of the right atrium begins slightly earlier and ends earlier (blue curve);
- excitation of the left atrium begins somewhat later and ends later (red curve);
- the total vector of the EMF of excitation of both atria draws a positive smoothed P wave, the leading edge of which forms the beginning of excitation of the right atrium, and the rear edge forms the end of excitation of the left atrium.
With hypertrophy of the left atrium, the vector of its excitation increases, which leads to an increase in the amplitude and duration of the second part of the P wave (lower figure), due to excitation of the left atrium. As a result, a double-humped wide P wave is formed in which the second peak of the wave exceeds the first in amplitude:
- with hypertrophy of the left atrium, the P wave is wide, double-humped (as a rule);
- the width of the P wave exceeds 0.1-0.12 s (5-6 cells);
- the height of the P wave is slightly increased;
- the P wave may be serrated at the apex (the distance between serrations exceeds 0.02 s or 1 cell).
With left atrial hypertrophy, the electrical axis of the P wave often deviates to the left (or takes a horizontal position): PI>PII>PIII.
Characteristic signs of a pathological P wave with left atrial hypertrophy in various leads:
- a wide double-humped P wave is usually recorded in leads: I, II, aVL, V5, V6 ;
- in lead aVR, the P wave is wide, double-humped, negative;
- the PV1 wave is negative or biphasic with a sharp predominance of the second negative phase, the width of which is increased - this is the most characteristic sign of left atrial hypertrophy.
With left atrial hypertrophy, the Macruse index (the ratio of the duration of the P wave to the duration of the PQ segment) is often greater than the upper permissible limit - 1.6. At the same time, the activation time of the left atrium increases, exceeding 0.06 s (3 cells) in leads I, aVL, V5, V6.
Electrocardiographic signs of left atrial hypertrophy can be caused by both hypertrophy itself and its dilatation, as well as their combination.
The atrial ECG complex with left atrial hypertrophy is called “P-mitrale” and most often it is observed in patients with mitral stenosis, aortic heart defects, hypertension, cardiosclerosis, congenital heart defects with overload of the left parts.
Left atrial overload
Overload of the left atrium is indicated if a wide double-humped P wave appears after an acute situation: a hypertensive crisis, an attack of cardiac asthma, pulmonary edema, myocardial infarction, etc. But with subsequent normalization of the patient’s condition, the ECG changes disappear. It is possible to clearly differentiate between hypertrophy of the left atrium and its overload only on the basis of dynamic ECG observation.
Top of page
ATTENTION! The information presented on the website DIABET-GIPERTONIA.RU is for reference only. The site administration is not responsible for possible negative consequences if you take any medications or procedures without a doctor’s prescription!
Top of page
Negative T
What does a negative T wave on an ECG indicate first? It indicates coronary heart disease. A negative T wave can also be caused by a heart attack if the deviation is accompanied by changes in the QRS complex.
The changes that the ECG graph will show allow us to judge the stage of necrosis of the damaged heart muscle:
- Acute stage. On the graph, abnormal QS, Q, ST segment will pass above the line. T is positive.
- Subacute stage. Characterized by negative T.
- Scarring. The T wave is slightly negative or positive.
Negative T waves in all leads of the electrocardiogram do not always indicate a serious pathology. Such indicators will be normal if the patient has rapid breathing and is worried. In addition, negative T may indicate that the person being examined has recently dined heavily on a dish containing a large percentage of carbohydrates. Therefore, proper preparation for an ECG is important to avoid false suspicions.
Negative T may also demonstrate an individual feature of the heart of completely healthy people.
Detailed interpretation of the electrocardiogram
The norm for the P wave is located above the isoline. This atrial wave can be negative only in leads 3, aVL and 5. In leads 1 and 2 it reaches its maximum amplitude. The absence of a P wave may indicate serious disturbances in the conduction of impulses through the right and left atrium. This tooth reflects the state of this particular part of the heart.
The P wave is deciphered first, since it is in it that the electrical impulse is generated and transmitted to the rest of the heart.
Splitting of the P wave, when two peaks are formed, indicates an enlargement of the left atrium. Often bifurcation develops with pathologies of the bicuspid valve. A double-humped P wave becomes an indication for additional cardiac examinations.
The PQ interval shows how the impulse passes to the ventricles through the atrioventricular node. The norm for this section is a horizontal line, since there are no delays due to good conductivity.
The Q wave is normally narrow, its width is no more than 0.04 s. in all leads, and the amplitude is less than a quarter of the R wave. If the Q wave is too deep, this is one of the possible signs of a heart attack, but the indicator itself is assessed only in conjunction with others.
The R wave is ventricular, so it is the highest. The walls of the organ in this zone are the densest. As a result, the electric wave travels the longest. Sometimes it is preceded by a small negative Q wave.
During normal heart function, the highest R wave is recorded in the left precordial leads (V5 and 6). However, it should not exceed 2.6 mV. A tooth that is too high is a sign of left ventricular hypertrophy. This condition requires in-depth diagnostics to determine the causes of the increase (ischemic heart disease, arterial hypertension, heart valve defects, cardiomyopathies). If the R wave decreases sharply from V5 to V6, this may be a sign of MI.
After this reduction, the recovery phase begins. On the ECG this is illustrated as the formation of a negative S wave. After a small T wave comes the ST segment, which normally should be represented by a straight line. The Tckb line remains straight, there are no bent areas on it, the condition is considered normal and indicates that the myocardium is completely ready for the next RR cycle - from contraction to contraction.
Pathologies indicated by negative T
However, in most cases, this indicator indicates various kinds of pathological conditions. A negative T wave will be observed in the following diseases and disorders:
- Subarachnoid hemorrhage.
- Condition after frequent extrasystoles, paroxysmal tachycardia.
- The so-called “pulmonary heart”.
- Violation of the nervous or hormonal regulation of the heart - diabetes mellitus, thyrotoxicosis, diseases affecting the adrenal glands or pituitary gland.
- A number of cardiac pathologies - cardiomyopathy, heart attack, inflammatory process in the pericardium, myocardium, angina pectoris, mitral valve prolapse, endocarditis.
Causes of a negative T wave
A negative T wave on an ECG, as described above, can have two scenarios. The first is to indicate serious heart disease with additional concomitant factors. The second is to manifest itself in a normal state as a result of other influences.
Possible causes of changes in the T wave:
- Negative “juvenile” T values in chest leads 1 to 4 can persist until the age of 30 in people of asthenic structure (mainly women).
- A similar symptom is typical for pulmonary hyperventilation (difficulty or rapid breathing) or after eating a large amount of carbohydrate-containing food.
- Negative T may be due to hormonal imbalance or signs of cor pulmonale.
- Sometimes the cause is a violation of ventricular repolarization. Huge deep teeth, sharply expanded in the Q-T segments, occur due to insufficient cerebral blood supply (subarachnoid hemorrhage).
- Negative T values can occur with impaired depolarization (contraction of the cardiac ventricles), characteristic of the termination of tachycardia, or with frequent extrasystole, which is not evidence of the development of myocardial ischemia (MI) and can last from several weeks to months.
- A negative T wave is typical when taking antidepressants, arrhythmic drugs and some other medications.
T wave on the cardiogram
- Negative symmetrical T waves can occur due to dysregulation of the autonomic nervous system.
- Negative T values, as a sign of coronary pathology, indicate heart disease: ischemic heart disease, various myocardial lesions, myocardial infarction, cardiomyopathy, pericardial inflammation, endocarditis, mitral valve dysfunction and the like.
Thus, the very fact of a negative T wave on the cardiogram is not a defining negative sign.
Two-phase T
Another name is a sign of a “roller coaster”. The T wave first falls below the isoline, after which it crosses it, becoming positive.
A biphasic T wave may indicate the following abnormalities:
- Blockade of the Hiss bundle branch elements.
- Intoxication with glycoside drugs.
- Hypertrophy of the left cardiac ventricle.
- Increased percentage of calcium in the blood.
Smoothed tooth
On the graph, T will appear somewhat flattened. The following reasons can lead to smoothing of the indicator:
- Abuse of alcoholic beverages, antidepressants, Cordarone.
- The patient is in a state of excitement or fear.
- Myocardial infarction, which is in the scarring stage.
- Diabetes.
- Excessive consumption of sugar, sweet foods and drinks before the examination.
- Neurocirculatory dystonia.
- Hypokalemia.
Reduced rate
This refers to the amplitude of the T wave - it will be less than 10% of the QRS complex. What does this deviation from the norm indicate?
There are several reasons for a reduced T-wave:
- Obesity, excess body weight.
- Cardiosclerosis.
- Hypothyroidism.
- The patient's advanced age.
- Tonsillitis.
- Myocardial dystrophy.
- Anemia.
- Dyshormonal cardiopathy.
Also, the cause of the deviation may be the patient taking corticosteroid drugs.
Inversion
Inversion - in other words, the inversion of the T wave. What does this look like on an electrocardiogram? The tooth changes its position relative to the isoline. That is, in leads with positive (normal) T, it suddenly reverses its own polarity.
Inversion will not always indicate pathology. It is considered normal with a juvenile configuration (if observed only in the right leads), signs of early repolarization, which is typical for professional athletes.
Inversion of T at the same time will be a sign of a number of diseases and pathologies:
- Bleeding in the brain.
- Recent attack of tachycardia.
- Ischemia of the brain or myocardium.
- Disturbances in the conduction of impulses along the Hiss bundle.
- A state of severe stress.
What is flattening of the T wave on an ECG?
The figure shows electrocardiograms
in leads I and III, recorded in patients with anterior wall infarction and with posterior wall infarction 1 year after the disease. The configuration of the QRS complex can be called typical for both clinical cases. Typically, the Q wave of the complex appears in lead I when the anterior wall is damaged and the muscle mass of the anterior wall of the left ventricle is reduced. When the posterior wall is affected, the Q wave is expressed in lead III due to a decrease in the muscle mass of the posterior periapical region of the ventricles.
Of course, not in all cases after a heart attack an electrocardiogram
looks exactly like this. Focal cicatricial changes in the myocardium, as well as focal conduction disturbances, cause a variety of unusual changes in the QRS complex (for example, the appearance of a too deep Q wave), a decrease in the amplitude of the waves, and an increase in the duration of the QRS.
Damage currents in angina pectoris
. Angina pectoris (“angina pectoris”) manifests itself in the form of attacks of pain in the heart, which patients feel in the upper part of the chest, behind the breastbone. The resulting pain often radiates to the neck and left arm. Such attacks are caused by moderate myocardial ischemia. Usually there is no pain at rest, but as soon as the load on the heart increases, paroxysmal pain appears.
Sometimes during an attack of angina on the electrocardiogram
there is a potential for damage because coronary blood flow is insufficient to ensure adequate repolarization of cells in ischemic areas of the myocardium.
Changes in the T wave on the electrocardiogram
As emphasized earlier, the T wave
normally positive in all three standard bipolar leads. Its appearance on the electrocardiogram is due to the fact that the apex and outer surface of the ventricles repolarizes earlier than the intraventricular surface. Consequently, changes in the T wave occur when the normal sequence of the repolarization process is disrupted. This can happen for various reasons.
The influence of slow propagation of the depolarization wave on the characteristics of the T wave
. Let us turn again to the figure, where the duration of the QRS complex of the electrocardiogram is increased. The reason for this is a delay in the conduction of excitation in the left ventricle, associated with blockade of the left leg of the A-V bundle. Left bundle branch block causes the left ventricle to depolarize 0.08 seconds later than the right. Due to this, the QRS vector shifts to the left. If we take into account that the duration of the refractory period of the right and left ventricles is approximately the same, it becomes clear that in the right ventricle the repolarization process begins earlier than in the left. This leads to the fact that during the formation of the T wave, the right ventricle already becomes electropositive, while the left ventricle remains electronegative. In other words, the resulting T vector shifts to the right - in the direction opposite to the QRS vector, therefore, with a significant delay in the conduction of excitation in the ventricles, the T wave is directed in the opposite direction compared to the QRS complex.
Shortening the period of depolarization in certain areas of the ventricles causes a change in the T wave
. If the period of depolarization in the region of the base of the ventricles is shortened (i.e., the duration of the action potential is reduced), repolarization of the ventricles begins not from the apex, as it usually happens, but from the base. Since the base of the ventricles repolarizes earlier than the apex of the heart, the repolarization vector is directed from the apex (“minus”) to the base (“plus”). In this case, the direction of the T vector changes to the opposite - and in all three standard leads a negative T wave is recorded instead of a positive one. Thus, shortening the action potential alone in the cells of the base of the ventricles leads to a pronounced change in the T wave.
The most common cause of shortening the depolarization period
is moderate ischemia, which occurs with acute or chronic blockage of the coronary arteries, as well as with relative coronary insufficiency during exercise. Ischemia leads to increased ion flow through potassium channels, resulting in T wave changes.
To identify the initial stages of coronary insufficiency
the patient is asked to perform a series of physical exercises, during which an electrocardiogram is recorded and changes in the T wave are noted. These changes are nonspecific, i.e. occur whenever in any part of the ventricles the period of depolarization becomes shorter than in the rest of the myocardium.
Effect of digitalis on the T wave
. Digitalis is a drug that is used for coronary artery disease to increase the force of heart contractions. Exceeding the dose of digitalis leads to the fact that the period of depolarization in some areas of the ventricles increases compared to others. As a result, nonspecific signs, such as a change in polarity or the appearance of a biphasic T wave, may occur in one or more leads of the electrocardiogram and become the earliest manifestations of overdose.
In this case negative
The T wave is asymmetrical. However, the existence of an additional primary factor, coronary heart disease, medication, etc., often causes an ECG picture that can first of all be explained by coronary artery disease, and then by enlargement of the left ventricle. In cardiomyopathy with predominant hypertrophy of the apical region of the heart, a characteristic picture of left ventricular enlargement without a q wave in lead V5-V6, but with a strongly negative narrow T wave, appears.
Flattened T wave
(two- and or single-phase): a. Artifacts, shortening of the time constant or other artifacts cause the smoothing of the T. b wave. After the administration of certain medications (amiodarone, prsnilamine, antidepressants, etc.).
V. Alcoholism. The T wave is often temporarily flattened after drinking alcohol. Moreover, 10% of patients with chronic alcoholism have a smoothed T wave, often biphasic and low-amplitude. d. Various organic processes: diabetes, myxedema, pancreatic diseases, etc. or functional states: fear, anxiety, etc.
d. After consuming a large amount of carbohydrates, a smoothed and even negative wave may appear. That is, after a test with hyperventilation or an ECG recorded in a standing position (for example, in patients with neurocirculatory asthenia), the same picture may occur. Holter monitoring shows that repolarization in healthy individuals undergoes diurnal changes, with flattened or even negative T waves often appearing, even if there is no evidence of heart disease. and. Some disturbances of electrolyte metabolism (for example, hypokalemia) also lead to the registration of a smoothed or slightly negative T wave. In such cases, more noticeable changes in the ECG occur (depression of the ST segment and the appearance of a U wave). Given the above, other causes of a flattened or negative T wave must first be ruled out before assuming that such repolarization changes are due to coronary artery disease. Comparison with clinical signs is a prerequisite for correct assessment of such repolarization changes.
Educational video of the norm and changes of T and U waves on an ECG
Flat T
A flattened, slightly inverted T is a controversial indicator. In individual cases it will be the norm. In some patients, it speaks of cardiac muscle dysfunction, ischemic, and degenerative processes.
May accompany the following serious diseases and dangerous conditions:
- Complete blockade of the ventricular pathways.
- Chronic or acute pancreatitis.
- Myocardial hypertrophy.
- Electrolyte or hormonal imbalance.
In addition, a flat T wave can be observed with systemic use of antiarrhythmic medications.
Coronary T
On the cardiogram, the T wave reflects the ability of the endocardium to maintain an electrical negative potential. It follows from this that with coronary insufficiency the tooth will change its direction. When violated, it is visualized in one of the following forms:
- Negative, negative.
- Isosceles.
- Pointed.
All of the above are so-called ischemic waves. Another name for them is coronary.
An important feature is that the waves will be most visible on the cardiogram in those areas where the greatest damage is observed. In mirror leads the indicator will be sharp and isosceles. The more pronounced the T on the graph, the more severe the myocardial damage.
Prong lift
An increase in amplitude can be a consequence of moderate physical overstrain of the patient, anemia, thyrotoxicosis, hyperkalemia, and various types of infections. This is also an individual norm for a number of healthy people.
The rise of the T wave may be one of the signs of vegetative-vascular pathologies with a predominance of vagal tone.
The T wave is an important indicator on the ECG. A specialist based on his deviations judges the development of diseases in the patient, the presence of dysfunctions - not only cardiac, but also nervous, hormonal, infectious or inflammatory.
Signs of ischemia
This chapter is called “ischemia” only conditionally, because ischemia is a clinical syndrome that can be accompanied by changes on the ECG. But the diagnosis of ischemia cannot be established from the ECG alone, except in cases of obvious ST elevation infarction with classic changes on the ECG. All other changes can occur in other diseases, including chronic ones, and are nonspecific. But our task is to learn how to interpret an ECG; I won’t teach you how to give a clinical assessment.