How the study of electrocardiography is structured on the site
In the “Textbook - simulator” section, educational topics on electrocardiography are posted in the form of lessons. At the end of each lesson there is a transition to exercises on this topic.
Familiarize yourself with the lesson content and get a general idea of the topic. Don't try to remember all the details right away. It will be more convenient to do this when further performing step-by-step exercises for the lesson.
Exercises are the main part of the teaching methodology on this site.
Perform consistently all the tasks that are offered after each lesson and in the control and repetition sections. This way you will be able to master the necessary knowledge and practical skills in electrocardiography in detail and without intense memorization.
Try it and decide if it's right for you.
The results of the exercises are saved in the database. This allows the site's computer program to evaluate your level on each academic topic. You can see the results of these assessments on the personal statistics page. Depending on how you perform the suggested training tasks, the statistics change accordingly.
Based on this data, the program determines which exercises to offer you and what additional information and explanations to provide you in a timely manner. This feedback tailors the learning to you.
The same exercise may be offered to you more than once during your work. Please complete all the tasks (and there should be many) patiently, as this will help you retain the information well and develop practical skills.
When starting the exercises, you need to log in (log in with your username and password) so that you can save information about the tasks you have completed in the database.
In addition to the “Textbook - simulator” section, read and regularly review the ECG in the “Examples of cardiograms” section.
For use in lesson texts, exercises and in the “Examples of cardiograms” section, the website has collected more than 1000 electrocardiograms from various sources. After each illustration there is a link to the source from which the example was taken.
How is an electrocardiogram performed?
A video ECG can help everyone understand how the procedure itself is carried out and what is required from the patient. In fact, everything is very simple and absolutely painless.
So, you have been assigned a time for electrocardiography, you have thoroughly prepared for it and are waiting under the office when you are invited. After you enter the office, the specialist will ask you to remove any outer clothing that is constricting your chest. You will also need to free your shins (if it is winter, then remove your socks and raise your pants a little). In the places where the electrodes should be attached, the specialist treats with an alcohol solution and applies a special gel to the skin.
Special electrodes are attached to the chest, hands and legs, the results of the impulses are recorded on paper and deciphered by a specialist
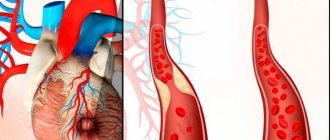
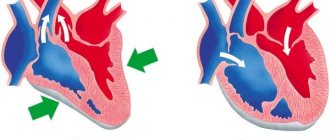
At the next stage, the doctor attaches cuffs and suction cups, which are fixed on the arms, chest and ankles. It is 10 electrodes that will monitor the rhythm of your heart organ and provide encrypted information on paper. It works in such a way that the impulse spreads throughout all parts of the heart and leads to depolarization of myocardial cells, at this time some of them receive a positive charge, and the rest receive a negative charge. Thus, a potential difference arises. After all this, the doctor receives a complete picture of the work of the heart organ, as well as any deviations in it. This medical procedure can detect the following heart diseases:
- myocardial infarction;
- ischemic disease;
- arrhythmia.
Read it! Taking an ECG
Financial conditions
All lessons in the section “Textbook - simulator”, “Examples of cardiograms” are available freely. Exercises for the first 15 lessons in the “Textbook - Simulator” are also available freely (only authorization is required).
Starting from section 16 (“sinus tachycardia”), exercises are available for a fee. The cost of access to all sections is 10 rubles per day (for 24 hours). You can choose any number of days of access to paid sections. To transfer money, go to the "Payment" section.
A guide to deciphering electrocardiograms (ECG)
Sinus tachycardia
1). Maintaining correct sinus rhythm (correct alternation of the P wave and the QRS complex in all leads).
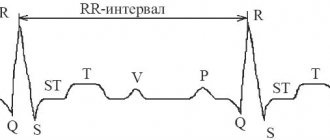
2). Increasing heart rate to 90-160 per minute (shortening the RR interval).
Sinus bradycardia
1). Maintaining correct sinus rhythm.
2). Reducing heart rate to 40-60 per minute (increasing the RR interval).
Sinus arrhythmia
1). Preservation of all signs of sinus rhythm.
2). Fluctuations in the duration of RR intervals (exceeding 10%) associated with the respiratory phases.
Sick sinus syndrome
1). Persistent sinus bradycardia.
2). Periodic appearance of ectopic (non-sinus rhythms).
3). Presence of sinoauricular block.
4). Bradycardia-tachycardia syndrome.
Atrial extrasystole
1). Premature extraordinary appearance of the P wave and the following QRST complex.
2). Deformation or change in the polarity of the P wave of the extrasystole. If P is positive - extrasystole from the upper part of the atrium, if P is negative - from the lower part of the atrium
3). The presence of an unchanged QRS complex, similar to normal ones.
4). The presence of an incomplete compensatory pause.
Extrasystoles from the AV node
1). Premature, extraordinary appearance on the ECG of an unchanged QRS complex, similar to a normal one. The P wave is absent.
2). Negative P wave at 11, 111 and AVF after an extrasystolic QRS complex or absence of a P wave (fusion of P and QRS).
3). The presence of an incomplete compensatory pause.
Ventricular extrasystole
1). Significant expansion and deformation of the ventricular complex, its high amplitude.
2). Absence of the P wave, since the impulse arising in the ventricle is not carried out retrogradely to the atrium.
3). Discordant direction of the initial part of the QRS complex and the ST segment and T wave.
4). Full compensatory pause.
Atrial paroxysmal tachycardia
1). A sudden onset and also suddenly ending attack of increased heart rate up to 140-250 per minute while maintaining the correct rhythm.
2). The presence of a reduced, deformed, biphasic or negative P wave in front of each ventricular complex.
3). Normal ventricular complexes, as before the attack.
Paroxysmal tachycardia from the AV node
1). A sudden onset and suddenly ending attack of increased heart rate up to 140-220 per minute while maintaining the correct rhythm.
2). The presence in 11, 111 and AVF of negative P waves located behind the QRS complexes or merging with them.
3). Normal ventricular complexes.
Ventricular paroxysmal tachycardia
1). A sudden onset and suddenly ending attack of increased heart rate up to 140-220 per minute while maintaining the correct rhythm.
2). Deformation and widening of the QRS complex with discordant location of the ST segment and T wave.
3). The presence of AV dissociation, i.e. complete separation of the atrial rhythm (P waves are not associated with ventricular complexes).
If the frequency of the ectopic rhythm ranges from 90 to 130 per minute, such tachtcardia is called non-paroxysmal. With a rhythm of 60-90 per minute, they speak of an accelerated ectopic rhythm.
Atrial flutter
1). The presence on the ECG of frequent - up to 200-400 per minute, regular, similar to each other, atrial F waves, having a characteristic sawtooth shape.
2). In most cases, there is a correct regular ventricular rhythm with equal RR intervals.
3). The presence of normal, unchanged QRS complexes, each of which is preceded by a certain (usually constant) number of atrial F waves (2:1, 3:1, 4:1, etc.).
Atrial fibrillation
1). Absence of P wave in all leads.
2). The presence throughout the entire cardiac cycle of random f waves, having different shapes and amplitudes.
3). The presence of QRS complexes, which usually have a normal appearance.
4). Irregularity of QRS complexes (different RR intervals).
5). Different amplitudes of R waves in one lead????
Ventricular flutter and fibrillation
1). The presence of frequent (up to 200-300 per minute) regular and identical in shape and amplitude flutter waves, reminiscent of a sinusoidal curve.
2). During ventricular fibrillation, frequent (200-500 per minute) but irregular waves are recorded, differing from each other in shape and amplitude.
Sinoatrial blockade
1). Periodic loss of individual cardiac cycles.
2). The increase in the pause between two adjacent P or R waves at the time of their loss is almost 2 times compared to the usual P-P or RR intervals.
Intraatrial block
1). Widening of the P wave and its deformation (bifurcation, two-phase).
2). The ventricular complex is not changed.
Atrioventricular blocks
1). With 1st degree AV block - an increase in the PQ interval of more than 0.2 seconds.
2). With 2nd degree AV block, there is loss of individual ventricular complexes.
3). With AV block of the 3rd degree - complete separation of the atrial and ventricular rhythms and a decrease in the number of ventricular contractions to 30-60 per minute or less.
Right bundle branch block
1). The presence in the right chest leads of ventricular complexes of the rSR' type, having an M-shape.
2). The presence in the left chest leads of a widened and often jagged S wave.
3). Increased width of the QRS complex.
4). The presence in leads V1 of ST segment depression with a convexity facing upward, as well as a negative, biphasic (+) asymmetric T wave.
5). With incomplete PNPG block, the ventricular complexes also have an M-shaped appearance, but are not dilated, and there are no changes in the ST segment or T wave.
Left bundle branch block
1). The presence in the left precordial leads of widened deformed ventricular complexes of type R with an expanded apex (“plateau”).
2). The presence in the right chest leads of widened deformed ventricular complexes, having the appearance of QS or rS with an expanded apex of the S wave.
3). Increased duration of the QRS complex.
4). The presence in the left precordial leads of a discordant ST segment displacement relative to the QRS and negative or biphasic asymmetric T waves.
Left atrial hypertrophy
1). Widening of the P wave, its splitting, bifurcation and increase in amplitude in leads 1, 11, AVL, V5-V6 (P-mitrale).
2). An increase in the amplitude and duration of the second negative (left atrial) phase of the P wave in V5-V6 and the formation of a negative P wave in V1.
Right atrial hypertrophy
1). An increase in the amplitude of the P wave in leads 11, 111, AVF, and the P wave becomes pointed (P-pulmonale), conical or tower-shaped.
2). The P wave does not widen.
3). In leads V1-V2, the P wave or its first (right atrial) phase is positive with a pointed apex (P-pulmonale).
Left ventricular hypertrophy
1). Enlargement of the R wave in the left precordial leads, with R (V6) > R (V4-V5).
2). Enlargement of the S wave in the right precordial leads.
3). EOS shift to the left
4). Widening of QRS complexes.
5). In the left chest leads there is a shift of the ST segment below the isoline and the presence of a negative or biphasic (+) T wave.
Right ventricular hypertrophy
1). EOS shift to the right.
2). Increased R amplitude in the right precordial leads.
3). Increased S amplitude in the left precordial leads.
4). Downward displacement of the ST segment and the appearance of negative T waves in the right precordial leads.
5). Widening of the QRS complex.
Signs of myocardial ischemia
1). With subendocardial ischemia - the appearance of high, pointed, symmetrical T wavelengths, and the ST segment is below the isoline.
2). With subepicardial or transmural ischemia, the T wave is negative, and the ST segment is elevated above the isoline.
3). The QT interval is usually prolonged.
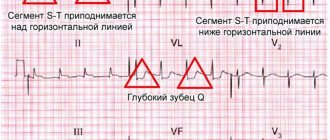
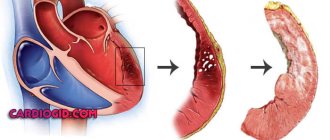
Myocardial infarction
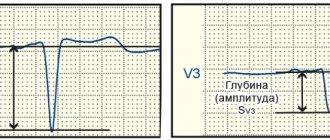
1). A deep and wide Q wave in the leads corresponding to the infarction (if it is normal, this is a small-focal infarction).
2). The ST segment is roughly raised above the isoline (Pardee's line).
3). Deep T wave.
In the most acute stage
— T is high and pointed, there is a Purdy line, but the Q wave is usually normal (since there is no necrosis yet).
In the acute stage
the presence of a deep Q wave, the ST segment is no longer so elevated (since the damage area decreases). A negative T wave begins to form.
In the subacute stage
— ST segment is slightly elevated. A characteristic feature is opposite changes in the ST segment in opposite leads (i.e., if ST is elevated in the left leads, then it is decreased in the right leads). The Q wave is pathological.
In the scar stage, pathological Q and negative T persist for life. The ST segment is on the isoline (or slightly higher).
A guide to deciphering an ECG with pictures in PDF format -
Save on social networks:
What does a cardiogram show?
On the printout or on the monitor you can see 6 teeth, designated in Latin letters: P, Q, R, S, T, U. The P wave shows how the atria work. The QRS complex reflects the movement of the impulse through the ventricles. The T wave is responsible for the renewal of the electrical potential of the myocardium, and the U wave is not important for diagnosis; its origin is not precisely known. The distance between the teeth is called segments, and it can also tell you a lot. The intervals on the cardiogram include teeth and segments.
Interesting! The designation of the teeth was invented by the Dutchman Willem Einthoven. He is also the first to record the ECG results in a form familiar to us today. For his work, the scientist was awarded the Nobel Prize.
Cardiogram of the heart
Each element of the ECG is responsible for a certain process and reflects its features. It is necessary to evaluate the height, width, length of the indicators, how they are located in relation to the isoline (straight line). The characteristics of the teeth, intervals and segments in different leads are also important. A lead is a specific area on the patient’s body to which the cardiograph sensor is attached. Standard electrocardiography is performed with 12 leads (standard, enhanced from the extremities, chest).
At first, deciphering the cardiogram may take 10-20 minutes. Specialists with extensive experience can identify deviations within half a minute. There is a certain recommended sequence of actions according to which doctors evaluate the result of cardiography. Anyone who learns this simple lesson will be able to interpret the ECG. You need to go through the following points one by one:
- rhythm;
- heart rate;
- source of impulse;
- myocardial conductivity;
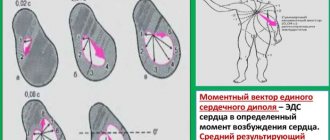
- electrical axis of the heart;
- analysis of elements on the cardiogram;
- conclusions.
Carrying out the procedure
Before the procedure, the patient undresses to the waist and lies down on the couch. The doctor attaches electrodes or special suction cups to the patient's chest, after which the device turns on and the heart impulses are recorded on paper.
The resulting electrocardiogram includes teeth of different lengths and heights, which display cardiac impulses. The ECG is interpreted by a cardiologist. When deciphering, heart rate, contraction intervals and other indicators of heart function are assessed.
In the branches of the “My Clinic”
On
Gorokhovaya St., 14/26
(metro station Admiralteyskaya, Admiralteysky district) and on
Varshavskaya st., 59
(metro station Moskovskaya, Moskovsky district) there are cardiologists who will conduct a heart examination and draw up a treatment or prevention plan.
You can sign up for an examination by calling 493-03-03 or on our website. Make an appointment
Preparing for an ECG
The procedure does not require hospitalization. Performing an ECG
takes 10-15 minutes and, as a rule, is combined with an appointment with a cardiologist. Proper preparation for an ECG will help avoid false results and the need for repeated examination.
- On the eve of the procedure, the patient is advised to get enough sleep and rest, and try to avoid stress.
- You should not exercise before the procedure.
- It is not recommended to use greasy lotions and creams in the chest area before an ECG.
Indications for ECG
The referral for the procedure is given by a cardiologist
.
Many groups of people should undergo regular ECGs in order to detect diseases early. Risk factors for heart disease include:
- smoking;
- age over 40 years;
- obesity;
- increased cholesterol levels in the blood;
- poor nutrition;
- passive lifestyle;
- the presence of abnormalities in the structure of the heart;
- increased level of stress;
- diseases of the nervous or endocrine system;
- diagnosed vascular atherosclerosis.
- increased physical activity
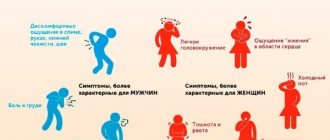
An unscheduled ECG is recommended for the following symptoms:
- chest pain;
- palpitations and interruptions;
- shortness of breath;
- high blood pressure;
- chest injury;
- suspicion of acute and chronic heart disease (for example, with symptoms of coronary heart disease).
If you notice the above symptoms, do not worry right away. Many of them - for example, shortness of breath or high blood pressure - occur during stress and physical activity. It is necessary to monitor your own condition and the dynamics of symptoms. If signs of heart disease bother you even in the absence of exercise, or do not improve over a long period of time, you should consult a cardiologist.
for examination.