0
Author of the article: Marina Dmitrievna
2017.07.27
3 369
Diagnostics
The electrical axis of the heart (EOS) is the first word that every person sees when they have a transcript of the cardiogram in their hands. When a specialist next to them adds that the EOS is in a normal position, the person being examined has nothing to worry about his health. But what if the axis takes a different position or has deviations?
What is the resulting vector?
An electrocardiogram is a test that measures the electrical activity of the heartbeat. With each beat, an electrical impulse (or "wave") travels through the heart. This wave causes the muscle to contract and pump blood away from the heart. A normal heartbeat on an ECG will show the synchronization of the upper and lower chambers.
ECG waves are caused by depolarization, not contraction, of the heart. This wave of depolarization occurs before the heart muscle begins to contract. A normal ECG consists of 5 waves, labeled from left to right as P, Q, R, S, and T. The P, R, and T waves are usually upward or positive waves, while the Q and S are usually downward or negative waves.
The right and left atria or superior chambers form the first wave, called the “P wave.” The right and left lower chambers or ventricles produce the next wave called the “QRS complex.” The final wave or “T wave” represents the electrical recovery or return of the ventricles to a resting state.
The resulting vector is the sum of 3 moments of excitation: the base of the heart, its apex and the interventricular septum (Q + R + S).
The alpha angle on the ECG is the sum of the positive and negative wave numbers of the interventricular complex (Q + R + S).
The amount of voltage recorded on the ECG is directly proportional to the amount of depolarized tissue. The majority of the heart's mass is made up of the ventricular myocardium. Therefore, the largest recorded waveform, the QRS complex, the resulting vector, reflects ventricular depolarization.
In addition, because the mass of the left ventricle is significantly greater than that of the right ventricle, most of the QRS complex reflects left ventricular depolarization, and the orientation of the mean electrical axis is to the left of the interventricular septum.
A good mathematical tool to represent the lead measurement is a vector. A vector is an object that has both magnitude and direction, such as speed.
At any point in the cardiac cycle, a vector can represent the net electrical activity observed by a lead (a standard ECG is represented by 12 leads). An electrical vector has a magnitude, direction, and polarity and is usually represented graphically as an arrow.
What is the electrical axis of the heart?
In healthy people, the electrical activity of the heart begins in the sinoatrial node and then spreads to the AV node, the atrioventricular node. It then passes down the His fiber bundle, along the Purkinje fibers, causing contraction of the ventricles. The cardiac axis gives an indication of the general direction of electrical activity.
When electrical activity is directed toward a lead, a positive deflection away from that lead is obtained.
Whenever the direction of electrical activity deviates from a lead, a negative deflection is obtained in that lead.
The cardiac axis represents the general direction of electrical activity, and its deviation is determined by the alpha angle.
What is the alpha angle?
The chest space has frontal, sagittal and transverse components. The frontal projection of the QRS direction is measured in 3 standard leads in 2 ways: as a measured angle (denoted alpha) and, more often, in clinical electrocardiographic interpretation, by simply examining the QRS components in leads 1, 2, 3.
The alpha angle on the ECG is the frontal projection of the criterion of normality and the criterion of axis deviation from the norm.
ECG: indications for examination
ECG is an effective diagnostic tool for assessing heart function
The ECG procedure shows the electrical activity of the heart, as well as various cardiac pathologies. This procedure can be carried out for prevention annually or according to indications.
A rightogram and a leftogram on an ECG, as a rule, indicate the presence of pathologies associated with the electrical axis of the heart. A cardiologist interprets the ECG. It is impossible to decipher it yourself without the help of a doctor. The heart is very heterogeneous in its electrical activity. Electrical processes and biocurrents in the heart are a complex mechanism that only an experienced doctor can understand and interpret. A referral for this procedure can be prescribed by a doctor of any specialty.
The doctor prescribes an ECG procedure in the following cases:
- Chest pain. Chest pain is a warning sign. This is how a heart attack can begin. In case of frequent and severe pain, an urgent ECG procedure is performed and if there are serious abnormalities, the patient is urgently hospitalized.
- Dyspnea. Shortness of breath is common with heart disease. Breathing becomes rapid, difficult, and there is a feeling of lack of air.
- Cardiopalmus. Tachycardia is felt as an increased heartbeat, which can be painful. It can be a sign of stress, increased workload or a pathological condition.
- Increased blood pressure. With hypertension, heart disease can often be detected, so chronic hypertensive patients regularly undergo an ECG procedure to check the functioning of the heart muscle.
- During pregnancy. During the period of bearing a child, a woman must undergo an ECG procedure, even if she has never had heart problems. Timely detection of heart failure is very important during pregnancy. For example, women with heart problems are not allowed to give birth; they undergo a planned caesarean section.
Preparation and procedure
Electrocardiography procedure
It is believed that the ECG procedure does not require any preparation, but doctors advise on the eve of the procedure to avoid stress and great physical and emotional stress.
Also, do not overuse strong tea and coffee, as these drinks affect the functioning of the heart. Only transesophageal ECG requires more complex preparation. You will need a diet and an empty stomach, since the procedure causes a strong gag reflex.
Features of ECG:
- The patient enters the office, undresses to the waist and removes his lower legs from clothing.
- Then you need to lie down on the couch.
- The doctor or nurse treats the skin with gel and attaches special electrodes to it.
- Special devices are attached to the arms, ankles and chest to detect electrical impulses. They are read by a special device and displayed on paper in the form of a graph, which only a specialist can decipher.
- After the procedure, the patient awaits the doctor's report. Usually the cardiogram along with the conclusion is given to the patient.
The ECG procedure may be accompanied by physical activity, but such an ECG has its contraindications. Physical activity is contraindicated in heart failure and myocardial infarction during an exacerbation.
The procedure for performing an ECG is simple and will take no more than 5 minutes.
Standard electrocardiography has virtually no contraindications, but some difficulties may arise:
- Excess weight. Obesity is often associated with heart disease, but it is difficult to perform an ECG procedure with a large body weight, since the electrical impulse will be weak.
- Chest injuries. In case of injuries and serious damage to the chest, it is problematic to attach electrodes.
- Hairline. Thick chest hair in men does not allow electrodes to be attached to the skin. In this case, you will have to sacrifice them and first shave the chest area.
What is the electrical position of the heart?
Electroposition is close in value to EOS. In this case, a horizon line is drawn - axis I of the first standard lead, and the resulting vector, QRS, will indicate the electrical position of the heart.
- The position is vertical. In this case, the QRS is located vertically relative to the axis.
- The position is horizontal. The resulting vector is visible on the cardiogram, which is located horizontally relative to the axis
Sometimes an intermediate electrical position occurs when the resulting vector is partially located semi-vertically and partially semi-horizontally. This is the basic electrical cardiac position.
Results
1. The electrical axis of the heart is the projection of the resulting vector in the frontal plane. 2. The electrical axis of the heart is capable of deviating from its normal position either to the right or to the left. 3. The deviation of the electrical axis of the heart can be determined by measuring the alpha angle.
| Alpha angle value | Position of the electrical axis of the heart |
| more than 90° | blockade of the posterior branch of the left leg |
| 90—70° | spelling |
| 70—50° | normogram |
| 50—0° | levogram |
| О—(-30)° | sharp leftogram |
| less than (-30)° | blockade of the anterior branch of the left leg |
4. The deviation of the electrical axis of the heart can be determined visually.
RI-SШ levogram RII > RI > RIII normogram SI-RIII rightogram
5. The electrical position of the heart is the position of the resulting vector of excitation of the ventricles in relation to axis I of the standard lead. 6. On the ECG, the electrical position of the heart is determined by the amplitude of the R wave, comparing it in leads aVL and aVF. 7. The following electrical positions of the heart are distinguished:
| Position | R wave amplitude | |
| Lead aVL | Lead aVF | |
| Horizontal | Large R wave | There is no R wave |
| Semi-horizontal | Large R wave | Small R wave |
| Main | The amplitude of the R waves is the same | |
| Semi-vertical | Small R wave | Large R wave |
| Vertical | There is no R wave | Large R wave |
Basic visual signs of the angle α at various positions in the electrical axis
On the ECG diagram, the method of visually finding the position of the EOS is available. In this case, the alpha angle is determined with an accuracy of ±100.
By analyzing the position of the R and S waves in leads I and III, it is possible to determine the axis deviation. The “algebraic sum” of angle α in this case is replaced by the dominant wave from the QRS position. The R wave is dominant, which means it is an R-type ventricular complex.
And if the S wave dominates, then they speak of an S type ventricular complex. The position of the EOS is normally observed if the amplitude of the R wave in leads I and II exceeds the amplitude of the R wave in lead III.
Alpha angle
Let us mentally place the resulting vector of ventricular excitation inside Einthoven’s triangle. The angle formed by the direction of the resulting vector and the I axis of the standard lead is the desired alpha angle.
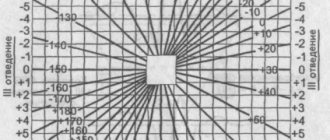
Alpha angle The value of the alpha angle is found using special tables or diagrams, having previously determined on the electrocardiogram the algebraic sum of the teeth of the ventricular complex (Q + R + S) in standard leads I and III. Finding the algebraic sum of the teeth of the ventricular complex is quite simple: measure in millimeters the size of each tooth of one ventricular QRS complex, taking into account that the Q and S waves have a minus sign (-), since they are below the isoelectric line, and the R wave has a plus sign (+ ). If any wave on the electrocardiogram is missing, then its value is equal to zero (0).
Algebraic sum of teeth in leads I and III Next, by comparing the found algebraic sum of teeth for standard leads I and III, the value of the alpha angle is determined from the table. In our case, it is equal to minus 70°.
EOS (electrical axis of the heart)
EOS reflects the average direction of ventricular depolarization during their contraction. The direction usually runs along the longitudinal axis of the heart (to the left and down).
Theoretical basis of definition
Normal EOS is between -30˚ and 90˚. If the deviation to the right is more than 90˚, they speak of right-sided axis deviation. The axis position rotates to -30˚, this is called left deflection. The axis is calculated with an accuracy of 1 degree.
The following rules apply:
- Normal axis: net positive QRS complex in leads I and II.
- Right axis deviation: net negative QRS complex in lead I but positive in lead II.
- Left axis deviation: net positive QRS complex in lead I, but negative in lead II.
- Extreme axis deviation (90 to 180˚): pure negative QRS complex in leads I and II.
Why do I use a pencil to diagnose or when I don’t need to look for the alpha angle?
The axis can be approximated manually by assessing the direction of the QRS complex in leads I and II. To do this, the back side of the pencil is applied to the corner of the cardiogram next to the first lead. In limb leads 1, 2, 3, a high, dominant R wave is determined.
The pointed part of the pencil is aimed at the R wave at the point of maximum abduction. When the EOS position is normal, the sharp tip of the pencil should rest on the lower left corner, and the other should rest on the upper right corner. If the pencil is positioned horizontally, then the axis is assumed to shift to the left. Moreover, if the pencil lies almost vertically, then this indicates an axial displacement to the right.
Why define a parameter?
The electrical axis is an important parameter. It communicates the net direction in which ventricular depolarization is moving. An axis can be defined for each ECG wave and important information can be obtained from each wave, for example, the P wave axis can tell whether the SA node controls the ventricles.
The concept of EOS norm
The position of the EOS depends on:
- The speed and correctness of impulse movement through the cardiac systems.
- Quality of myocardial contractions.
- Conditions and pathologies of organs that affect the functionality of the heart.
- Heart condition.
For a person who does not suffer from serious diseases, the axis is characteristic:
- Vertical.
- Horizontal.
- Intermediate
- Normal.
The normal position of the EOS is located according to Died at coordinates 0 – +90º. For most people, the vector passes the limit of +30 – +70º and is directed to the left and down.
In an intermediate position, the vector passes within +15 – +60 degrees.
According to the ECG, the specialist sees that the positive waves are longer in the second, aVF and aVL leads.
What is the normal EOS?
The mean axis can be determined in the interval by first looking at the amplitude of the R wave and then at the combined amplitudes of the Q wave, R waves, and S waves. The resulting vector, called the QRS axis, approximates the mean EOS.
The QRS axis is the “mean” direction of electrical activity during ventricular depolarization. The QRS axis may shift due to a physical change in the position of the heart, chamber hypertrophy, or conduction block.
The normal QRS axis is -30 to +90 degrees. A value more negative than -30 is called left axis deviation. A value more positive than +90° is called axis deviation to the right.
The QRS axis can shift during the respiratory cycle if the rise of the diaphragm changes the physical position of the heart. Changes in the QRS axis (changes in QRS shape) are called “electrical alternans.” It is thought to be caused by physical vibrations of the heart in the pericardial effusion.
Normal for children and adults
The principles of ECG interpretation in children are identical to those in adults, but the progressive changes in anatomy and physiology that occur between birth and adolescence result in some features that differ significantly from the normal adult pattern and vary with the age of the child.
Therefore, correct interpretation of ECG is potentially difficult, and detailed knowledge of these age-related changes is critical.
| Age | Normal QRS Axis Values | Abnormal values | Description |
| For adults | 30 — 90° | <30° | EOS deviation to the left |
| From 30 to - 45° | Moderate axis deviation to the left | ||
| From – 45 to 90° | Marked deviation of the EOS to the right | ||
| From 90 to 120° | Moderate deviation to the right | ||
| From 90 to 180° | Marked deviation of the EOS to the right | ||
| From 8 to 16 years | 0 — 120° | >120° | Deviation to the right |
| From 5 to 8 years | 0 — 140° | >140° | Deviation to the right |
| < 0° | Deviation to the left | ||
| From 1 year to 5 years | 5 — 100° | >100° | Deviation to the right |
| From 1 month to 1 year | 10 — 120° | >120° | Deviation to the right |
| From <10 to - 90° | Deviation to the left | ||
| Newborns | 30 — 90° | > 190 to — 90° | Extreme deviation to the right |
| < 30 to <- 90° | Deviation to the left |
Standards of normal values to aid in the interpretation of ECGs in children have been known for many years. Rhythm changes observed in apparently normal children during random 24-hour observation periods have been well described, but the longer-term consequences of these changes have not been systematically examined.
Reasons for EOS deviation to the left
Leftward axis movement occurs when additional electrical forces move to the left (hypertrophy) or when the time required for electrical activity to move through the ventricle increases.
Some causes of EOS shift to the left include hypertension, aortic stenosis or regurgitation, hypertrophic subaortic stenosis, mitral valve regurgitation, and impaired left ventricular conduction.
EOS deviation to the left
The deviation of the electrical axis to the left is the location of the vector in the range of 0 – -90º. A distance of up to -30º in some cases is normal, but the slightest excess of the indicator can be regarded as a symptom of a serious illness. In some people, such indicators are provoked by deep exhalation.
Important! In women, a change in the coordinates of the heart in the chest can be triggered by pregnancy.
Reasons why the axis deviates to the left:
- LV hypertrophy.
- Disruption or blockage of the His bundle.
- Myocardial infarction.
- Myocardial dystrophy.
- Heart defects.
- Violation of CM contractions.
- Myocarditis.
- Cardiosclerosis.
- Calcium accumulations in the organ, blocking normal contraction.
These ailments and pathologies can provoke an increase in the mass and size of the LV. Because of this, the tooth on this side is longer, resulting in a deviation of the electrical axis to the left.
Limits of deviation of the electrical axis of the heart
To determine the heart axis in the frontal plane, an analysis of 2 or more limb leads is required, for which vector analysis is performed. In this case, ventricular depolarization is represented as an average depolarization vector with an arrow pointing in a certain direction.
The length of the vector represents the magnitude of the potential created by the difference in charges between the activated (or depolarized) cardiac cells and the resting cardiac cells, while the direction of the arrow represents the average direction of the depolarization vectors.
Ventricular depolarization spreads from the negatively charged area to the positively charged area.
Comparison of Q and S waves of the QRS complex
The complete QRS complex consists of the Q, R and S waves. However, all 3 waves may not be visible, and there are always differences between leads. Some leads can reflect all waves, while others can only reflect 1 wave. If the first wave is negative, then it is called a Q wave. If it is not negative, this means that the complex does not have this wave, regardless of the appearance of the QRS complex.
Any negative wave that occurs after a positive one is called an S wave.
The Q wave reflects the excitation of the left half of the interventricular septum.
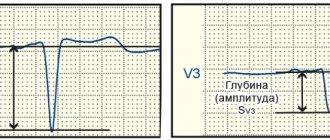
The S wave is the deepest negative wave and indicates the terminal excitation of the base of the left ventricle.
The QS complex is not usually considered a sign of previous myocardial infarction. But there may be other causes, especially in older people, such as left ventricular hypertrophy.
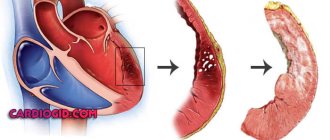
Why does deviation occur?
When the axis is deviated to the left, this means that the patient has left ventricular hypertrophy.
The causes of the disease include:
- Hypertension. Especially in cases of frequent increases in blood pressure.
- Ischemic diseases.
- Chronic heart failure.
- Cardiomyopathy. This disease is the growth of the heart muscle in a mass and expansion of its cavities.
- Pathology of the aortic valve. They can be congenital or acquired. They provoke blood flow disturbances and LV reloading.
Important! Very often, hypertrophy worsens in people who spend a lot of time on varied sports activities.
With a strong deviation of the axis to the right, a person may have PR hypertrophy, which is caused by:
- High pressure in the arteries of the lungs, which causes bronchitis, asthma and emphysema.
- Pathological diseases of the tricuspid valve.
- Ischemia.
- Heart failure.
- Blocking of the posterior branch of the His node.
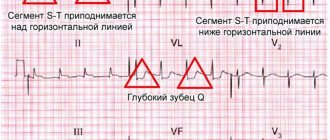
ECG for “cor pulmonale”
Normal position of the electrical axis of the heart
The cardiac electrical axis of a healthy person is located in the sector from 0° to +90°, and only occasionally goes beyond these limits. Normally, it corresponds to the human anatomical axis.
The alpha angle on the ECG, which has a value from +300 to + 690, and the position of the axis is normal, then in this case the R wave ≈ the S wave.
Thus, when the QRS in leads I and II deflects in the positive direction, all deviations from the right, left, and terminal axis are eliminated. Consequently, the electrical axis of the heart in this case is within normal limits.
When the QRS in leads 1 and 2 deviates predominantly in the positive direction, all deviations from the left, right and terminal axes are eliminated. Consequently, the electrical axis of the heart is within normal limits.
Definition of EOS
The electrical axis is the average direction of action potentials passing through the ventricles during their activation (depolarization). The ventricular complex, QRS, representing their depolarization, is used to determine the electrical axis.
The term "cardiac electrical axis" usually refers to the electrical axis in the frontal plane as measured by the limb leads. The QRS axis is the main vector of ventricular activation, which is the overall direction of electrical activity.
What is EOS
The electrical axis of the heart is a conventional line, which is determined by the result of studying the electrocardiogram and demonstrates the approximate direction of propagation of electrical impulses throughout the heart.
The conduction system is responsible for the propagation of electrical signals throughout the organ and the synchronous operation of its different sections (atria and ventricles) - a complex of nerve nodes in which the impulse is generated and fibers that carry out its propagation. This system consists of the following elements:
| Conduction system component | Location |
| Sinus node. | Right atrium in the region of the superolateral wall. |
Sinoatrial fibers (bundles):
| In the area of the interatrial septum, the anterior wall of the right atrium. Connects the sinus and atrioventricular nodes. |
| Atrioventricular node. | At the border of the atria and ventricles, in the region of the lower part of the interatrial septum. |
| Bundle branches (right and left). | The bundle branches pass through the interventricular septum, each diverging to its own ventricle (right and left), after which it branches into Purkinje fibers in the muscles. |
| Purkinje fibers. |
Normally, the impulse sequentially passes through all of the above structures. EOS allows you to identify this vector and draw a conclusion about the position of the heart, as well as suspect a change in the size of its parts. Using an electrocardiogram and a lead system built in accordance with Einthoven’s triangle, it is possible to determine not only the presence, but also the possible cause of these disorders
Alpha Angle Determination Table
Alpha is the angle between the vertical and the slope of the wave. The direction of the electrical axis is expressed by the angle α. It is formed at the intersection of the electrical axis and the horizon, which passes through the conventional electrical heart center.
| 50-70˚ | EOS is normal |
| 70-90˚ | Pravogramma, when the EOS deviates to the right. |
| > 90˚ | Block of the posterior bundle branch of His. |
| from 50 to 0˚ | Levogram, deviation to the left. |
| from 0 to -30˚ | Sharply expressed levogram. |
| ≈ in — 45˚ | Confirmed block of the left bundle branch of His. |
In people who do not have heart disease, the α angle ranges from 0° to +90.
Clinical interpretation of ECG requires detailed and specific measurements of the frontal plane QRS axis and its variations. Accurate measurement of the alpha angle is therefore necessary in certain situations until computerization of the electrocardiogram routinely provides data for analysis and thus helps more fully establish the significance of certain forms of axis deviation.
Reasons for EOS deviation to the right
The deviation of the axis to the right is fixed when it passes between +90 – +180º. This shift can be caused by:
- Damage to the pancreas by infarction.
- The simultaneous occurrence of coronary artery disease and hypertension - they deplete the heart with a vengeance and provoke failure.
- Pulmonary diseases of a chronic nature.
- Incorrect passage of electrical impulses along the right branch of the His bundle.
- Pulmonary emphysema.
- Severe strain on the pancreas caused by obstruction of the pulmonary artery.
- Dextrocardia.
- Mitral heart disease, which provokes pulmonary hypertension and stimulates the work of the pancreas.
- A thrombotic block of blood flow in the lungs, which causes a deficiency of the organ in the blood and overloads the entire right side of the heart.
Because of these pathologies, the specialist determines on electrocardiography that the EOS is deviated to the right.
EOS deviation to the right