Basic visual signs of the alpha angle value at different
variants of position in the electrical axis
Normal position of the electrical axis: alpha angle from +40° to +70°. Maximum lead II (largest R wave) or aVR, minimum lead aVL (or III); RII>RI>RIII.
Vertical and semi-vertical position of the electrical axis: alpha angle from +70° to +90°. Maximum lead aVF (or II and aVF); minimal lead aVL (or I); RII>RIII>RI.
Horizontal and semi-horizontal position of the electrical axis: alpha angle from +40° to 0°. Maximum lead I (or aVR and I); minimal lead aVF (or III); RI>RII>RIII.
Deviation of the electrical axis of the heart to the right: the alpha angle is greater than +90. Maximum lead III (or III and aVF); minimum - aVR (or I); RIII>RII; SI>RI.
A pronounced deviation of the electrical axis of the heart to the right: the alpha angle is +120 or more. The maximum value of the R wave in lead III or the S wave in lead aVL, with a minimum value of R in leads aVR or II; RIII>RII; RaVR>Q(S)aVR.
Deviation of the electrical axis of the heart to the left: alpha angle from 0° to -30°. The maximum value of R is in lead I or aVL, the minimum - aVF or II; RI>RII; SIII>RIII; SaVF>RaVF;
A pronounced deviation of the electrical axis of the heart to the left: alpha angle -30° or more (with a negative value). The maximum value of the R wave in lead aVL or the S wave in lead III; minimum height of the R wave in lead II or aVR; RaVL>RI; SII>RII.
Normal ECG variants include variants of the position of the electrical axis within the alpha angle values from +100° to -15° (-25°), provided there are no other pathological changes in the teeth (Fig. 2.7).
The normal position of the electrical axis, its vertical and horizontal position, can be determined by analyzing the ECG in people with a healthy heart. A slight deviation of the electrical axis of the heart to the left or right, if there are no other changes on the ECG, does not indicate myocardial damage. A significant deviation of the electrical axis of the heart to the left or right is one of the signs of hypertrophy and changes in the myocardium of the corresponding ventricle. A horizontal position of the electrical axis of the heart can occur in persons with a hypersthenic constitution, during pregnancy, or with a high position of the diaphragm. In asthenics, the position of the electrical axis of the heart is vertical.
The position of the electrical axis is calculated as follows: the direction of the QRS complex in leads I and III is determined separately by algebraically adding all its positive and negative teeth. In this case, a plus sign is placed in front of the teeth directed upwards from the isoline, and a minus sign in front of those directed downward.
Example. In lead I in the QRS complex R = 8 mm Q = 2 mm S = 3 mm. Their algebraic sum is /8/+/-2/+/-3/=+3. In lead III, R = 7 mm, Q = 1 mm, S = 4 mm. Their algebraic sum is equal to: /+7/+/-1/+/-4/=+2. Then they use special tables. R.Ya. Written or special diagram. For our example, the direction of the electrical axis corresponds to +54. (For tables for determining the alpha angle, see the appendix).
93.79.221.197 © studopedia.ru Not the author of the materials posted. But it provides the opportunity to use it for free. Is there a copyright violation? Write to us | Feedback.
Disable adBlock! and refresh the page (F5)
very necessary
Read online “The ABCs of ECG” by Yuri Ivanovich Zudbinov – RuLit – Page 8
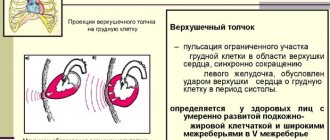
However, when the heart deviates from its normal anatomical position in the chest (asthenic and hypersthenic physique, ventricular hypertrophy, lung diseases, etc.), the anterior and posterior walls may be represented by other parts of the heart. This must be taken into account for accurate topical diagnosis of pathological processes occurring in one or another part of the heart.
In addition to topical diagnosis of the pathological process in various parts of the myocardium, electrocardiographic leads make it possible to trace the deviation of the electrical axis of the heart and determine its electrical position. We will talk about these concepts below.
Chapter III
Electrical axis and electrical position of the heart
III.1. Resulting vector
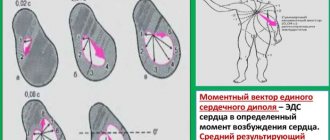
The electrical axis and electrical position of the heart are inextricably linked with the concept of the resulting vector of ventricular excitation in the frontal plane.
The resulting vector of ventricular excitation is the sum of three momentary excitation vectors: the interventricular septum, the apex and base of the heart. This vector has a certain orientation in space, which we interpret in three planes: frontal, horizontal and sagittal. In each of them, the resulting vector has its own projection.
Rice. 26. Projection of a vector in various planes
III.2. Electrical axis of the heart
The electrical axis of the heart is the projection of the resulting vector of excitation of the ventricles in the frontal plane.
The electrical axis of the heart may deviate from its normal position either to the left or to the right.
The exact deviation of the electrical axis of the heart is determined by the alpha angle (α).
III.3. Angle α
Let us mentally place the resulting vector of ventricular excitation inside Einthoven’s triangle. The angle formed by the direction of the resulting vector and the I axis of the standard lead is the desired alpha angle.
Rice. 27. Angle alpha.
The value of the alpha angle is found using special tables or diagrams, having previously determined on the electrocardiogram the algebraic sum of the teeth of the ventricular complex ( Q + R + S ) in standard leads I and III.
Finding the algebraic sum of the teeth of the ventricular complex is quite simple: measure in millimeters the size of each tooth of one ventricular complex QRS , taking into account that the Q and S have a minus sign (-), since they are below the isoelectric line, and the R has a plus sign (+ ). If any wave on the electrocardiogram is missing, then its value is equal to zero (0).
Rice. 28. Algebraic sum of the teeth of leads I and III
Next, by comparing the found algebraic sum of the teeth for standard leads I and III, the value of the alpha angle is determined from the table. In our case, it is equal to minus 70°.
Table for determining the position of the electrical axis of the heart (according to Diede)
Rice. 29. Table for determining the alpha angle
If the alpha angle is in the range of 50–70°, we speak of a normal position of the electrical axis of the heart (the electrical axis of the heart is not deviated), or a normogram.
When the electrical axis of the heart deviates to the right, the alpha angle will be determined within 70–90°. In everyday life, this position of the electrical axis of the heart is called a rightogram.
If the alpha angle is greater than 90° (for example, 97°), it is considered that this ECG shows a block of the posterior branch of the left bundle branch.
When determining the alpha angle within 50-0°, one speaks of a deviation of the electrical axis of the heart to the left, or a levogram.
A change in the alpha angle within 0 - minus 30° indicates a sharp deviation of the electrical axis of the heart to the left or, in other words, a sharp leftogram.
And finally, if the value of the alpha angle is less than minus 30° (for example, minus 45°), they speak of blockade of the anterior branch of the left bundle branch.
Rice. thirty . Limits of deviation of the electrical axis of the heart
EOS (electrical axis of the heart)
EOS is the total vector of electromotive force or ventricular depolarization. This definition is given in almost all manuals on deciphering cardiograms. It is quite difficult to understand and can scare off the inquisitive minds of beginners, especially non-medical people.
Let's understand in simple, accessible words what is the electrical axis of the heart? If we imagine the propagation of electrical impulses from the sinus node to the underlying parts of the conduction system of the heart in the form of vectors, it becomes obvious that these vectors spread to different parts of the heart, first from the atria to the apex, then the excitation vector is directed slightly upward along the side walls of the ventricles. If the direction of the vectors is added or summed, you get one main vector that has a very specific direction. This vector is the EOS.
Electrical axis of the heart
N.B. Familiarize yourself with the lesson content and get a general idea of the topic. Don't try to remember all the details right away. It will be more convenient to do this when further performing step-by-step exercises for the lesson. The link to the exercises is at the bottom of the page.
The electrical axis of the heart (EOA) is the direction in which the electrical impulse propagates during excitation of the ventricles.
Diagram 1 shows the normal position of the EOS. The electrical impulse of excitation, originating in the sinus node, reaches the atrioventricular node and then spreads through the ventricles.
Thus, excitation impulses “move” through the heart in different directions. This is shown in the diagram with small blue arrows. EOS is the total vector of multidirectional excitation impulses.
EOS in diagram 1 is shown with large blue arrows.
Scheme 1. Electrical axis of the heart (normal options)
This diagram shows that the electrical impulse normally moves from the atria to the apex of the heart, that is, to the left and down (option on the left). This corresponds to the normal anatomical position of the heart in the chest.
With a hypersthenic or asthenic physique of a person, the anatomical position of the heart in the chest changes. A change in the anatomical axis of the heart leads to a change in the electrical axis of the heart.
With a hypersthenic physique (for example, with obesity), due to the elevation of the diaphragm, the heart is located more horizontally than usual. In this case, the EOS, in accordance with Scheme 1, deviates counterclockwise (option in the center).
This change is called leftward deviation.
With an asthenic physique, due to the low position of the diaphragm, the heart is located more vertically than usual. In this case, the EOS, in accordance with Scheme 1, is deflected clockwise (option on the right). This change is called a deviation to the right.
Scheme 2. Six-axis diagram for determining EOS in the frontal plane
The diagram below shows six limb leads: I, II, III, aVL, aVF, aVR. Next to each lead it is indicated what deviation in degrees the EOS will correspond to if the electrical excitation wave is directed to this lead.
Standard lead I was taken as the reference point. If the EOS is oriented towards lead I, then the angle of deviation of the EOS is zero. In such cases, we talk about the horizontal position of the EOS. If the EOS is oriented towards lead aVF, then the angle of deflection of the EOS is 900. In such cases, we speak of the vertical position of the EOS.
For diagnostic purposes, the following assessments of the position of the electrical axis of the heart are used:
- Normal EOS position: from -30o to 90o.
- EOS deviation to the left: from -30o to -90o.
- EOS deviation to the right: from 90o to 180o.
- Sharp (or extreme) deviation of EOS: from -90o to 180o.
In addition, within the normal position of the EOS, the terms horizontal position of the EOS (from 00 to 300) and vertical position of the EOS (from 700 to 900) are used.
With various pathological changes, the position of the EOS can change significantly and this explains the diagnostic value of this ECG parameter.
With left ventricular hypertrophy, overload of the left ventricle (for example, with arterial hypertension), and slower conduction of excitation through the left ventricle, electrical activity in the left half of the heart increases. This often leads to deviation of the EOS to the left.
With right ventricular hypertrophy, overload of the right ventricle (for example, with pulmonary embolism), or slower conduction of excitation through the right ventricle, electrical activity in the right half of the heart increases. This often leads to deviation of the EOS to the right.
Determination of EOS by ECG
The position of the EOS on the cardiogram is determined by the QRS complexes, which are recorded in the limb leads: I, II, III, aVL, aVF, aVR.
The EOS is oriented from leads in which the QRS complexes have a negative polarity (i.e., the QRS waves are located predominantly below the isoline) towards leads in which the QRS complexes have a positive polarity (i.e., the QRS teeth are located predominantly above the isoline).
See how this looks in ECG 1.
ECG 1. EOS deviation to the left. The angle is -300
ECG 1 shows that the highest R waves are recorded in leads aVL and I, and the deepest S waves are recorded in leads III and aVF. From this we can conclude that the electrical impulse during excitation of the ventricles spread from III and aVF towards aVL and I.
Also pay attention to lead II, in which the positive R is almost equal to the negative S. Such a QRS complex, in which the algebraic sum of the waves is equal to zero (or near zero) is called isoelectric. In ECG 1, the electrical impulse travels perpendicular to lead II.
To determine in which direction the electrical excitation wave propagates, it is necessary to compare the algebraic sum of the QRS complex teeth in the limb leads. To do this, from the amplitude of the positive wave R (height R in mm), it is necessary to subtract the amplitude of the negative waves Q and S (depth of the teeth Q and S in mm): R – (Q+S).
On ECG 1, the maximum algebraic sum of QRS waves in lead aVL. In aVL, the tooth R = 17 mm, Q = 2 mm, the tooth S is absent, so the sum of the teeth is 17 mm - 2 mm = 15 mm.
Similarly, we determine that the minimum algebraic sum of QRS waves will be in lead III: R = 3 mm, S = 19 mm, i.e. 3 mm – 19 mm = -16 mm.
Therefore, as already mentioned, the electrical axis of the heart is directed from lead III towards lead aVL.
When the EOS deviation is -300, as shown in ECG 1, the maximum positive sum is R-(Q+S) in lead aVL, the maximum negative sum is R-(Q+S) in lead III. The algebraic sum of the R – (Q+S) waves is equal to or close to zero in lead II.
The position of the EOS is determined in degrees in accordance with the diagram shown in ECG 1 on the right. In the given example on ECG 1, the EOS is directed towards aVL, so here the deviation angle will be equal to -300 and in such cases they speak of a deviation of the EOS to the left.
The table in Scheme 3 lists possible combinations of R-(Q+S) values for different EOS positions.
Scheme 3. Table for determining the position of the EOS
Let us consider these provisions of the EOS using specific examples.
EOS deviation to the left
Above (on ECG 1) the option of deviation of the EOS to the left with an angle of -300 was considered. ECG 2 shows a variant of EOS deviation to the left with an angle of -600.
With a deviation of -600, the maximum positive sum is R-(Q+S) in lead aVL, the maximum negative sum is R-(Q+S) in lead III. The algebraic sum of the R – (Q+S) waves is equal to or close to zero in leads I and II.
ECG 2. EOS deviation to the left. The angle is -600
ECG source.
Normal position of the EOS
There are three options for the normal position of the EOS:
- horizontal position of the EOS with an angle from 00 to 300.
- normal position of the EOS with an angle equal to or about 600.
- vertical position of EOS from 700 to 900.
With a horizontal deviation of the EOS with an angle of 00, the maximum positive sum is R-(Q+S) in lead I, the maximum negative sum is R-(Q+S) in lead aVR. The algebraic sum of the R – (Q+S) waves is equal to or close to zero in lead aVF.
ECG 3. Normal (horizontal) position of the EOS. Angle is 0
ECG source.
With a normal EOS deviation with an angle of +300, the maximum positive sum is R-(Q+S) in leads I and II, the maximum negative sum is R-(Q+S) in lead aVR. The algebraic sum of the R – (Q+S) waves is equal to or close to zero in lead III.
ECG 4. Normal position of the EOS. The angle is +300
ECG source.
With a normal EOS deviation with an angle of +600, the maximum positive sum is R-(Q+S) in lead II, the maximum negative sum is R-(Q+S) in lead aVR. The algebraic sum of the R – (Q+S) waves is equal to or close to zero in lead aVL.
ECG 5. Normal position of the EOS. The angle is +600
ECG source.
With a vertical deviation of the EOS with an angle of +900, the maximum positive sum is R-(Q+S) in lead aVF, the maximum negative sum is R-(Q+S) in leads aVR and aVR. The algebraic sum of the waves R – (Q+S) is equal to or close to zero in lead I.
ECG 6. Normal (vertical) position of the EOS. The angle is +900
ECG source.
EOS deviation to the right
When the EOS deviates to the right with an angle of +1200, the maximum positive sum is R-(Q+S) in lead III, the maximum negative sum is R-(Q+S) in lead aVL. The algebraic sum of the R – (Q+S) waves is equal to or close to zero in lead aVR.
ECG 7. EOS deviation to the right. The angle is +1200
ECG source.
When the EOS deviates to the right with an angle of +1500, the maximum positive sum is R-(Q+S) in lead III, the maximum negative sum is R-(Q+S) in lead aVL. The algebraic sum of the waves R – (Q+S) is equal to or close to zero in lead II.
ECG 8. EOS deviation to the right. The angle is +1500
ECG source.
Sharp (or extreme) deviation of the EOS
With a sharp deviation of the EOS with an angle of +1800, the maximum positive sum is R-(Q+S) in lead aVR, the maximum negative sum is R-(Q+S) in lead I. The algebraic sum of the R – (Q+S) waves is equal to or close to zero in lead aVF.
ECG 9. Sharp deviation of EOS. The angle is +1800
ECG source.
With a sharp deviation of the EOS with an angle of -900, the maximum positive sum is R-(Q+S) in leads aVR and aVL, the maximum negative sum is R-(Q+S) in lead aVF. The algebraic sum of the waves R – (Q+S) is equal to or close to zero in lead I.
In the example on ECG 10, the EOS shift to the left is slightly greater than -900.
ECG 10. Sharp deviation of EOS. Deflection angle -1000
ECG source.
On ECG 4, the highest R wave is in lead aVR and slightly lower in lead aVL. The maximum negative sum of QRS waves in leads II and aVF.
Thus, the EOS is directed from leads II and aVF towards lead aVR (red arrow in the diagram on the right). Therefore, on ECG 4 there is a sharp (or extreme) deviation of the EOS: the deviation angle is -1000.
The given cardiogram was taken from a patient with severe pulmonary pathology with overload of the right heart.
The main criteria for determining the position of the electrical axis of the heart on an ECG:
- The position of the EOS is determined by the limb leads: I, II, III, aVF, aVL, aVR.
- The positive pole of the I standard lead is taken as the zero reference point. In relation to this point, the coordinates of the remaining limb leads are determined. Lead I: 00.
- Lead II: +600.
- Lead III: +1200.
- aVL lead: -300.
- aVF lead: +900.
- aVR lead: -1500.
- Normal EOS position: from -30o to 90o.
Go to exercises
Source: https://learnecg.ru/lessons/electricheskaia_os_serdca.php
Alpha angle
Let us mentally place the resulting vector of ventricular excitation inside Einthoven’s triangle. The angle formed by the direction of the resulting vector and the I axis of the standard lead is the desired alpha angle.
The value of the alpha angle is found using special tables or diagrams, having previously determined on the electrocardiogram the algebraic sum of the teeth of the ventricular complex (Q + R + S) in standard leads I and III.
Finding the algebraic sum of the teeth of the ventricular complex is quite simple: measure in millimeters the size of each tooth of one ventricular QRS complex, taking into account that the Q and S waves have a minus sign (-), since they are below the isoelectric line, and the K wave has a plus sign (+ ). If any wave on the electrocardiogram is missing, then its value is equal to zero (0).
Next, by comparing the found algebraic sum of the teeth for standard leads I and III, the value of the alpha angle is determined from the table. In our case, it is equal to minus 70°.
Table for determining the position of the electrical axis of the heart (according to Diede)
Alpha Angle Determination Table
If the alpha angle is within 50-70°, we speak of a normal position of the electrical axis of the heart (the electrical axis of the heart is not deviated), or a normogram.
When the electrical axis of the heart deviates to the right, the alpha angle will be determined within 70-90°. In everyday life, this position of the electrical axis of the heart is called a rightogram.
If the alpha angle is greater than 90° (for example, 97°), it is considered that this ECG shows a block of the posterior branch of the left bundle branch.
When determining the alpha angle within 50-0°, one speaks of a deviation of the electrical axis of the heart to the left, or a levogram.
A change in the alpha angle within 0 - minus 30° indicates a sharp deviation of the electrical axis of the heart to the left or, in other words, a sharp leftogram.
And finally, if the value of alpha is less than minus 30° (for example, minus 45°), they speak of blockade of the anterior branch of the left bundle branch.
Limits of deviation of the electrical axis of the heart
Determination of the deviation of the electrical axis of the heart by the alpha angle using tables and diagrams is carried out mainly by doctors in functional diagnostics offices, where the corresponding tables and diagrams are always at hand.
Alpha angle and beta angle. Decoding
The position of the joints and head of the femur is assessed not only visually. To determine their condition, a special measurement of angles is used according to the Graph table. There is an Alpha angle and a Beta angle.
- Alpha denotes the development of the bony part of the fossa acetabula.
- Beta describes the cartilaginous space within the cocetabulum.
For healthy children, it is considered normal if the Alpha angle is more than 60 degrees and the Beta angle is less than 55 degrees.
A slight excess of 55 degrees is acceptable; such a joint is considered normal and mature. But if the Beta angle is 77 degrees, the doctor will suspect a dislocation or subluxation. Pathology is also indicated by the Alpha angle, which ranges from 43 degrees.
The norm of angles in the table is as follows.
| Angle "Alpha" | Angle "Beta" | bony prominence | Conclusion |
| More than 60 degrees | Within 55 degrees | Smoothed | Mature healthy joint |
| 50-59 degrees | Less than 55 degrees, fits tightly around the femoral head | Rounded | Physiologically immature joint |
| 50-59 degrees | Less than 55 degrees | Round, almost flat | Delayed ossification |
| 43-49 degrees | Less than 77 degrees | Flattened | Poor prognosis |
| 43-49 degrees | Over 77 degrees | Flattened or flat | Initial decentration |
| Less than 43 degrees | Doesn't cover the head | Flat | Decentration, complete immaturity of the joint |
As the child grows, indicators may change; this is what the doctor will take into account during the ultrasound. If the child is already four months old, the most correct and accurate examination method will be an x-ray.
If problems are detected, doctors try to simultaneously examine the bone structure of the small pelvis. Quite often, the pathology of the hip joint is reflected specifically in it.
In conclusion, the doctor may be laconic and will prefer to limit himself to an alphanumeric designation of the type of joint found in the child. Remember that a healthy joint is always designated as 1A or 1B.
If the report states that joint 2A or 2B was detected, this means that the child has signs of physiological immaturity, which will most likely go away on its own, but will still require observation by a pediatric orthopedist.
Joint 2C is a joint with signs of preluxation. Observation by a doctor and compliance with all his recommendations is required. 3A and 3B - joints with subluxation. The most severe pathology is type 4 joint. This is how a hip joint with signs of dislocation (dysplasia) is designated.
Definition of EOS
Let us mentally place the resulting vector of ventricular excitation inside Einthoven’s triangle. The angle formed by the direction of the resulting vector and the I axis of the standard lead is the desired alpha angle.
The value of the alpha angle is found using special tables or diagrams, having previously determined on the electrocardiogram the algebraic sum of the teeth of the ventricular complex (Q + R + S) in standard leads I and III. Finding the algebraic sum of the teeth of the ventricular complex is quite simple: measure in millimeters the size of each tooth of one ventricular QRS complex, taking into account that the Q and S waves have a minus sign (-), since they are below the isoelectric line, and the K wave has a plus sign (+ ). If any wave on the electrocardiogram is missing, then its value is equal to zero (0).
Next, by comparing the found algebraic sum of the teeth for standard leads I and III, the value of the alpha angle is determined from the table. In our case, it is equal to minus 70°. Table for determining the position of the electrical axis of the heart (according to Diede)
Alpha Angle Determination Table
If the alpha angle is within 50-70°, we speak of a normal position of the electrical axis of the heart (the electrical axis of the heart is not deviated), or a normogram. When the electrical axis of the heart deviates to the right, the alpha angle will be determined within 70-90°. In everyday life, this position of the electrical axis of the heart is called a rightogram.
If the alpha angle is greater than 90° (for example, 97°), it is considered that this ECG shows a block of the posterior branch of the left bundle branch. When determining the alpha angle within 50-0°, one speaks of a deviation of the electrical axis of the heart to the left, or a levogram. A change in the alpha angle within 0 - minus 30° indicates a sharp deviation of the electrical axis of the heart to the left or, in other words, a sharp leftogram. And finally, if the value of alpha is less than minus 30° (for example, minus 45°), they speak of blockade of the anterior branch of the left bundle branch.
Limits of deviation of the electrical axis of the heart
Determination of the deviation of the electrical axis of the heart by the alpha angle using tables and diagrams is carried out mainly by doctors in functional diagnostics offices, where the corresponding tables and diagrams are always at hand. However, it is possible to determine the deviation of the electrical axis of the heart without the necessary tables. In this case, the deviation of the electrical axis is determined by analyzing the R and S waves in standard leads I and III. In this case, the concept of the algebraic sum of the teeth of the ventricular complex of the QRS complex is replaced visually with the concept of “defining tooth”, comparing the R and S waves in absolute value. They speak of an “R-type ventricular complex,” meaning that in this ventricular complex the K wave is higher. On the contrary, in the “S-type ventricular complex,” the defining wave of the QRS complex is the S wave.
Comparison of K waves and 3rd QRS complex
If on the electrocardiogram in the first standard lead the ventricular complex is represented by the R-type, and the QRS complex in the third standard lead has an S-type shape, then in this case the electrical axis of the heart is deviated to the left (levogram).
Schematically, this condition is written as RI-SIII.
Visual determination of the electrical axis of the heart
. Levogram On the contrary, if in standard lead I we have the S-type of the ventricular complex, and in lead III the R-type of the QRS complex, then the electrical axis of the heart is deviated to the right (rightogram). Simplified, this condition is written as SI-RIII.
Visual determination of the electrical axis of the heart
. Pravogram The resulting vector of ventricular excitation is normally located in the frontal plane so that its direction coincides with the direction of axis II of the standard lead.
Normal position of the electrical axis of the heart
(normogram) The figure shows that the amplitude of the R wave in standard lead II is the greatest. In turn, the K wave in standard lead I exceeds the RIII wave. Under this condition of the ratio of the R waves in various standard leads, we have a normal position of the electrical axis of the heart (the electrical axis of the heart is not deviated). A short notation for this condition is RII>RI>RIII.
Angle alpha in physics. What is the alpha angle?
Let us mentally place the resulting vector of ventricular excitation inside Einthoven’s triangle. The angle formed by the direction of the resulting vector and the axis I of the standard lead is the desired angle alpha.
The value of the alpha angle is found using special tables or diagrams, having previously determined on the electrocardiogram the algebraic sum of the teeth of the ventricular complex (Q + R + S) in standard leads I and III.
Finding the algebraic sum of the teeth of the ventricular complex is quite simple: measure in millimeters the size of each tooth of one ventricular QRS complex, taking into account that the Q and S waves have a minus sign (-), since they are below the isoelectric line, and the R wave has a plus sign (+ ). If any wave on the electrocardiogram is missing, then its value is equal to zero (0).
Next, by comparing the found algebraic sum of the teeth for standard leads I and III, the value of the alpha angle is determined from the table. In our case, it is equal to minus 70°.
If the alpha angle is within 50-70°, we speak of a normal position of the electrical axis of the heart (the electrical axis of the heart is not deviated), or a normogram. When the electrical axis of the heart deviates to the right, the alpha angle will be determined within 70-90°. In everyday life, this position of the electrical axis of the heart is called a rightogram.
If the alpha angle is greater than 90° (for example, 97°), it is considered that this ECG shows a blockade of the posterior branch of the left bundle branch. When determining the alpha angle within 50-0°, one speaks of a deviation of the electrical axis of the heart to the left, or a levogram. A change in the alpha angle within 0 - minus 30° indicates a sharp deviation of the electrical axis of the heart to the left or, in other words, a sharp leftogram. And finally, if the value of the alpha angle is less than minus 30° (for example, minus 45°), they speak of blockade of the anterior branch of the left bundle branch.
Determination of the deviation of the electrical axis of the heart by the alpha angle using tables and diagrams is carried out mainly by doctors in functional diagnostics offices, where the corresponding tables and diagrams are always at hand. However, it is possible to determine the deviation of the electrical axis of the heart without the necessary tables.
In this case, the deviation of the electrical axis is determined by analyzing the R and S waves in standard leads I and III. In this case, the concept of the algebraic sum of the teeth of the ventricular complex is replaced by the concept of the “defining tooth” of the QRS complex, visually comparing the R and S waves in absolute value. They speak of the “R-type ventricular complex,” implying that in a given ventricular complex the R wave is the higher one. In contrast, in the “S-type ventricular complex,” the defining wave of the QRS complex is the S wave.
If on the electrocardiogram in the first standard lead the ventricular complex is represented by the R-type, and the QRS complex in the third standard lead has an S-type shape, then in this case the electrical axis of the heart is deviated to the left (levogram). Schematically, this condition is written as RI-SIII.
On the contrary, if in standard lead I we have an S-type ventricular complex, and in lead III an R-type QRS complex, then the electrical axis of the heart is deviated to the right (rightogram). Simplified, this condition is written as SI-RIII.
The resulting vector of ventricular excitation is normally located in the frontal plane so that its direction coincides with the direction of axis II of the standard lead.
The figure shows that the amplitude of the R wave in standard lead II is greatest. In turn, the R wave in standard lead I exceeds the RIII wave. Under this condition of the ratio of the R waves in various standard leads, we have a normal position of the electrical axis of the heart (the electrical axis of the heart is not deviated). A short notation for this condition is RII>RI>RIII.
Alpha angle on ecg table
In this issue I will briefly touch on these issues. From the next issues we will begin to study pathology.
Also, previous issues and materials for a more in-depth study of the ECG can be found in the section “ Articles and video lessons on deciphering the ECG
«.
What is the resulting vector?
Electrical axis and electrical position of the heart
are inextricably linked with the concept of the resulting vector of ventricular excitation in the frontal plane.
The resulting vector of ventricular excitation
is the sum of three moment vectors of excitation: the interventricular septum, the apex and base of the heart. This vector has a certain orientation in space, which we interpret in three planes: frontal, horizontal and sagittal. In each of them, the resulting vector has its own projection.
What is the electrical axis of the heart?
Electrical axis of the heart
called the projection of the resulting vector of ventricular excitation in the frontal plane.
The electrical axis of the heart may deviate from its normal position either to the left or to the right. The exact deviation of the electrical axis of the heart is determined by the alpha (a) angle.
Angle alpha symbol. Attack angle
Angle of attack (common designation α {\displaystyle \alpha } - letter of the Greek alphabet alpha) - the angle between the direction of the velocity vector of the flow (liquid or gas) incident on the body and the characteristic longitudinal direction selected on the body, for example, for an airplane wing this will be the chord of the wing , for an airplane - the longitudinal construction axis, for a projectile or rocket - their axis of symmetry. When considering a wing or an airplane, the angle of attack is in the normal plane, as opposed to the angle of glide.
Angle of attack sensors for an air-to-air missile
For an aircraft in horizontal straight flight, an increase in speed and angle of attack leads to an increase in the lift force generated by the wing. At the same time, an increase in the angle of attack is accompanied by growth.
The Supermarine Type 322 torpedo/dive bomber, the Vought F-8 Crusader carrier-based fighter (Vought F-8 Crusader, 1953) and the prototype Martin XB-51 bomber (English) (1949) had a variable angle in flight wing installation.