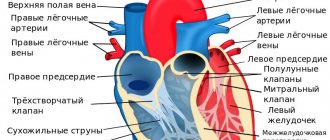
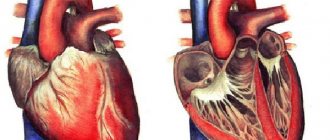
Cardiac cycle - systole and diastole
Alternate contraction and relaxation of cardiomyocytes ensures synchronous functioning of the entire heart. The cardiac cycle consists of:
- pauses – general relaxation (diastole) of all parts of the myocardium, atrioventricular valves are open, blood passes into the cavities of the heart;
- atrial systole - movement of blood into the ventricles;
- contractions of the ventricles - release of the great vessels.
Atrial
The impulse for myocardial contraction occurs in the sinus node. After the vascular openings are blocked, the atrial cavity becomes closed. At the moment the entire muscle layer is covered by excitation, the fibers are compressed and blood is pushed into the ventricles. The valve flaps open under pressure. The atria then relax.
Normally, the atrial contribution to the total filling of the ventricles is insignificant, since they are already 80% filled during the pause period. But with an increase in the frequency of contractions (flickering, fluttering, fibrillation, supraventricular form of tachycardia), their role in filling increases significantly.
We recommend reading the article on systolic and diastolic pressure. From it you will learn about the norm in indicators between systolic and diastolic pressure, what affects the indicators and how to normalize the values. And here is more information about functional extrasytols.
Zheludochkov
The first period of contractions is called myocardial tension. It lasts until the valve flaps of large vessels leaving the ventricles open. Consists of 2 parts: non-simultaneous contraction (asynchronous) and isometric. The latter means the involvement of all myocardial cells in the work. The blood flow closes the atrial valves, and the ventricle is completely closed on all sides.
The second stage (expulsion) begins with the opening of the valve flaps of the pulmonary trunk and aorta. It also has two periods - fast and slow. At the end of cardiac output, pressure increases in the vascular network, and when it becomes equal to cardiac pressure, systole stops and diastole begins.
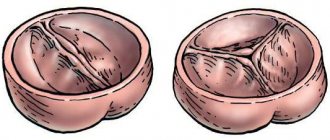
Heart sounds
The heart makes characteristic sounds similar to a knock. Each beat consists of two main tones. The first is the result of contraction of the ventricles, or, more precisely, the slamming of valves, which, when the myocardium is tense, close the atrioventricular openings so that blood cannot return to the atria. A characteristic sound is produced when their free edges close. In addition to the valves, the myocardium, the walls of the pulmonary trunk and aorta, and tendon threads take part in creating the shock.
The second sound is formed during ventricular diastole. This is the result of the semilunar valves, which prevent blood from flowing back, blocking its path. A knock is heard when they connect in the lumen of the vessels with their edges.
In addition to the main tones, there are two more - the third and fourth. The first two can be heard using a phonendoscope, while the other two can only be recorded by a special device.
Difference between systole and diastole
For the heart muscle, relaxation is no less important than contraction. By apt definition, diastole makes systole. This period is just as active. During this time, actin and myosin filaments diverge in the cardiac muscle, which, according to the Frank-Starling law, determines the force of cardiac output - the greater the stretch, the greater the contraction.
The ability to relax depends on the fitness of the heart muscle; in athletes, due to prolonged diastole, the contraction frequency is reduced, and blood flow through the coronary vessels increases at this time. There are two phases during the relaxation period:
- protodiastolic (the reverse movement of blood closes the valve flaps of blood vessels);
- isometric – straightening of the ventricles.
This is followed by filling, and then atrial systole begins. Upon completion, the ventricular cavities are ready for subsequent contraction.
Time of systole, diastole, pause
If the heart rate is normal, then the approximate duration of the entire cycle is 800 milliseconds. Of these, individual stages account for (ms):
- atrial contraction 100, relaxation 700;
- ventricular systole 330 – asynchronous tension 50, isometric 30, ejection 250;
- Ventricular diastole 470 – relaxation 120, filling 350.
Expert opinion
Alena Ariko
Expert in Cardiology
That is, for most of the life (470 to 330) the heart is in a state of active rest. In response to stress, the frequency of contractions increases precisely due to a decrease in relaxation time. An accelerated pulse is considered one of the risk factors for diseases of the circulatory system, since the myocardium does not have time to recover and accumulate energy for the next beat, which leads to a weakening of the heart.
At the moment of contraction of the left ventricle of the heart
After the end of ventricular systole, the diastolic period of the ventricles of the heart
(
diastole
), lasting 0.47 s. It includes the following periods and phases (at a heart rate of 75 per minute):
Relaxation period
(0.12 s), consisting of: -
protodiastolic interval
- 0.04 s (time from the beginning of relaxation of the ventricular myocardium to the closure of the semilunar valves);
- phase of isometric (isovolumic) relaxation
- 0.08 s (time from the closure of the semilunar valves to the opening of the atrioventricular valves).
Filling period
(0.35 s) consisting of: -
rapid filling phase
- 0.08 s (from the moment the atrioventricular valves open);
— slow filling phase
— 0.18 s;
- ventricular filling phase
caused by atrial systole - 0.09 s.
Rice.
9.9. Comparison of the action potential and myocardial contraction with the phases of changes in excitability . 1 — depolarization phase; 2 — phase of initial rapid repolarization; 3 — slow repolarization phase (plateau phase); 4 — phase of final rapid repolarization; 5 - absolute refractory phase; 6 — phase of relative refractoriness; 7 - phase of supernormal excitability. Myocardial refractoriness practically coincides not only with excitation, but also with the period of contraction.
Towards the end of ventricular systole and the beginning of diastole
(from the moment the semilunar valves close), the ventricles contain a residual, or reserve, volume of blood (end-systolic volume).
At the same time, a sharp drop in pressure in the ventricles begins (the phase of isovolumic, or isometric, relaxation). The ability of the myocardium to quickly relax is the most important condition for filling the heart with blood. When the pressure in the ventricles (initial diastolic) becomes less than the pressure in the atria, the atrioventricular valves open and the rapid filling phase begins, during which blood accelerates from the atria to the ventricles. During this phase, up to 85% of their diastolic volume enters the ventricles. As the ventricles fill, the rate at which they fill with blood decreases (slow filling phase). At the end of ventricular diastole, atrial systole begins, as a result of which another 15% of their diastolic volume enters the ventricles. Thus, at the end of diastole, an end-diastolic volume is created in the ventricles, which corresponds to a certain level of end-diastolic pressure in the ventricles. End-diastolic volume and end-diastolic pressure constitute the so-called preload of the heart, which is the determining condition for the stretching of myocardial fibers, i.e., the implementation of the Frank-Starling law
.
What determine the phases of systole and diastole?
The factors that determine the distensibility and subsequent contractility of the myocardium include:
- wall elasticity;
- thickness of the heart muscle, its structure (scar changes, inflammation, dystrophy due to malnutrition);
- cavity size;
- structure and patency of valves, aorta, pulmonary artery;
- activity of the sinus node and the speed of propagation of the excitation wave;
- condition of the pericardial sac;
- blood viscosity.
Watch the video about the cardiac cycle:
Reasons for violation of indicators
Violation of myocardial contractility and weakening of systole cause ischemic and dystrophic processes - angina pectoris, cardiosclerosis, amyloidosis, myocardial dystrophy, myocarditis. Due to narrowing of the valve openings or difficulty in ejecting blood from the ventricles, the amount of residual blood in their cavities increases, and a reduced volume enters the vascular network.
Such changes are characteristic of congenital and acquired heart defects, hypertrophic cardiomyopathy, and narrowing of the great vessels.
Violation of the formation of an impulse or its movement through the conduction system changes the sequence of myocardial excitation, the synchrony of systole and diastole of parts of the heart, and reduces cardiac output. Arrhythmias change the duration of the phases of the cardiac cycle, the efficiency of ventricular contractions and the possibility of their complete relaxation.
Diseases that are accompanied by diastolic and then systolic dysfunction also include:
- pericarditis;
- bacterial endocarditis;
- arterial and pulmonary hypertension;
- hypotension;
- systemic autoimmune pathologies;
- disorders of endocrine regulation - diseases of the thyroid gland, pituitary gland, adrenal glands;
- vegetative-vascular dystonia is an imbalance between parts of the autonomic nervous system.
ECG: interpretation in adults, norm in the table
Electrocardiography is a method of measuring potential differences arising under the influence of electrical impulses of the heart.
The result of the study is presented in the form of an electrocardiogram (ECG), which reflects the phases of the cardiac cycle and the dynamics of the heart.
During the heartbeat, the sinus node, located near the right atrium, generates electrical impulses that travel along nerve pathways, contracting the myocardium (heart muscle) of the atria and ventricles in a certain sequence.
After the myocardium contracts, the impulses continue to travel throughout the body as an electrical charge, resulting in a potential difference - a measurable value that can be determined using the electrocardiograph electrodes.
Features of the procedure
In the process of recording an electrocardiogram, leads are used - electrodes are placed according to a special scheme.
To fully display the electrical potential in all parts of the heart (anterior, posterior and lateral walls, interventricular septa), 12 leads are used (three standard, three reinforced and six chest), in which electrodes are located on the arms, legs and certain areas of the chest.
During the procedure, electrodes record the strength and direction of electrical impulses, and the recording device records the resulting electromagnetic oscillations in the form of teeth and a straight line on special paper for recording ECG at a certain speed (50, 25 or 100 mm per second).
Paper registration tape uses two axes. The horizontal X axis shows time and is indicated in millimeters. Using a time period on graph paper, you can track the duration of the processes of relaxation (diastole) and contraction (systole) of all parts of the myocardium.
The vertical Y axis is an indicator of the strength of the impulses and is indicated in millivolts - mV (1 small box = 0.1 mV). By measuring the difference in electrical potentials, pathologies of the heart muscle are determined.
The ECG also shows leads, each of which alternately records the work of the heart: standard I, II, III, thoracic V1-V6 and enhanced standard aVR, aVL, aVF.
ECG indicators
The main indicators of the electrocardiogram characterizing the work of the myocardium are waves, segments and intervals.
Serrations are all sharp and rounded bumps written along the vertical Y axis, which can be positive (upward), negative (downward), or biphasic. There are five main waves that are necessarily present on the ECG graph:
- P – recorded after the occurrence of an impulse in the sinus node and sequential contraction of the right and left atria;
- Q – recorded when an impulse appears from the interventricular septum;
- R, S – characterize ventricular contractions;
- T - indicates the process of relaxation of the ventricles.
Segments are areas with straight lines, indicating the time of tension or relaxation of the ventricles. There are two main segments in the electrocardiogram:
- PQ – duration of ventricular excitation;
- ST – relaxation time.
An interval is a section of an electrocardiogram consisting of a wave and a segment. When studying the PQ, ST, QT intervals, the time of propagation of excitation in each atrium, in the left and right ventricles is taken into account.
ECG norm in adults (table)
Using a table of norms, you can conduct a sequential analysis of the height, intensity, shape and length of the teeth, intervals and segments to identify possible deviations. Due to the fact that the passing impulse spreads unevenly throughout the myocardium (due to the different thickness and size of the heart chambers), the main normal parameters of each element of the cardiogram are identified.
IndicatorsNorm
| Prongs | |
| P | Always positive in leads I, II, aVF, negative in aVR, and biphasic in V1. Width - up to 0.12 sec, height - up to 0.25 mV (up to 2.5 mm), but in lead II the wave duration should be no more than 0.1 sec |
| Q | Q is always negative and is normally absent in leads III, aVF, V1 and V2. Duration up to 0.03 sec. Height Q: in leads I and II no more than 15% of the P wave, in III no more than 25% |
| R | Height from 1 to 24 mm |
| S | Negative. Deepest in lead V1, gradually decreases from V2 to V5, may be absent in V6 |
| T | Always positive in leads I, II, aVL, aVF, V3-V6. Always negative in aVR |
| U | Sometimes it is recorded on the cardiogram 0.04 seconds after T. The absence of U is not a pathology |
| Interval | |
| PQ | 0.12-0.20 sec |
| Complex | |
| QRS | 0.06 - 0.008 sec |
| Segment | |
| ST | In leads V1, V2, V3, it shifts upward by 2 mm |
Based on the information obtained from deciphering the ECG, conclusions can be drawn about the characteristics of the heart muscle:
- normal functioning of the sinus node;
- functioning of the conduction system;
- frequency and rhythm of heart contractions;
- the state of the myocardium – blood circulation, thickness in different areas.
ECG interpretation algorithm
There is a scheme for deciphering an ECG with a sequential study of the main aspects of heart function:
- sinus rhythm;
- Heart rate;
- rhythm regularity;
- conductivity;
- EOS;
- analysis of teeth and intervals.
Sinus rhythm is a uniform heartbeat rhythm caused by the appearance of an impulse in the AV node with gradual contraction of the myocardium. The presence of sinus rhythm is determined by deciphering the ECG using P wave indicators.
Also in the heart there are additional sources of excitation that regulate the heartbeat when the AV node is disturbed. Non-sinus rhythms appear on the ECG as follows:
- Atrial rhythm - P waves are below the baseline;
- AV rhythm – P is absent on the electrocardiogram or comes after the QRS complex;
- Ventricular rhythm - in the ECG there is no pattern between the P wave and the QRS complex, while the heart rate does not reach 40 beats per minute.
When the occurrence of an electrical impulse is regulated by non-sinus rhythms, the following pathologies are diagnosed:
- Extrasystole is premature contraction of the ventricles or atria. If an extraordinary P wave appears on the ECG, as well as when the polarity is deformed or changed, atrial extrasystole is diagnosed. With nodal extrasystole, P is directed downward, absent, or located between QRS and T.
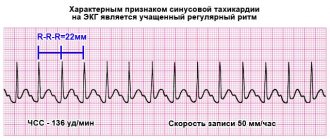
- Paroxysmal tachycardia (140-250 beats per minute) on the ECG can be presented in the form of an overlay of the P wave on the T wave, standing behind the QRS complex in standard leads II and III, as well as in the form of an extended QRS.
- Flutter (200-400 beats per minute) of the ventricles is characterized by high waves with difficult to distinguish elements, and with atrial flutter, only the QRS complex is distinguished, and sawtooth waves are present in place of the P wave.
- Flicker (350-700 beats per minute) on the ECG is expressed in the form of inhomogeneous waves.
Heart rate
The interpretation of the ECG of the heart must contain heart rate indicators and is recorded on tape. To determine the indicator, you can use special formulas depending on the recording speed:
- at a speed of 50 millimeters per second: 600/ (number of large squares in the RR interval);
- at a speed of 25 mm per second: 300/ (number of large squares between RR),
Also, the numerical indicator of the heartbeat can be determined by the small cells of the RR interval, if the ECG tape was recorded at a speed of 50 mm/s:
- 3000/number of small cells.
The normal heart rate for an adult is between 60 and 80 beats per minute.
Regularity of rhythm
Normally, the RR intervals are the same, but an increase or decrease of no more than 10% from the average value is allowed. Changes in the regularity of the rhythm and increased/decreased heart rate can occur as a result of disturbances in automatism, excitability, conductivity, and contractility of the myocardium.
When the automatic function is impaired, the following interval indicators are observed in the heart muscle:
- tachycardia - heart rate is in the range of 85-140 beats per minute, a short period of relaxation (TP interval) and a short RR interval;
- bradycardia - heart rate decreases to 40-60 beats per minute, and the distances between RR and TP increase;
- arrhythmia – different distances are tracked between the main heartbeat intervals.
Conductivity
To quickly transmit an impulse from the source of excitation to all parts of the heart, there is a special conduction system (SA and AV nodes, as well as the His bundle), the violation of which is called blockade.
There are three main types of blockades - sinus, intraatrial and atrioventricular.
With sinus block, the ECG shows a violation of impulse transmission to the atria in the form of periodic loss of PQRST cycles, while the distance between RRs increases significantly.
Intraatrial block is expressed as a long P wave (more than 0.11 s).
Atrioventricular block is divided into several degrees:
- I degree – prolongation of the PQ interval by more than 0.20 s;
- II degree - periodic loss of QRST with an uneven change in time between complexes;
- III degree - the ventricles and atria contract independently of each other, as a result of which there is no connection between P and QRST in the cardiogram.
Electric axis
EOS displays the sequence of impulse transmission through the myocardium and normally can be horizontal, vertical and intermediate. In ECG interpretation, the electrical axis of the heart is determined by the location of the QRS complex in two leads - aVL and aVF.
In some cases, axis deviation occurs, which in itself is not a disease and occurs due to an enlargement of the left ventricle, but, at the same time, may indicate the development of pathologies of the heart muscle. As a rule, the EOS deviates to the left due to:
- ischemic syndrome;
- pathology of the valve apparatus of the left ventricle;
- arterial hypertension.
A tilt of the axis to the right is observed with enlargement of the right ventricle with the development of the following diseases:
- pulmonary stenosis;
- bronchitis;
- asthma;
- pathology of the tricuspid valve;
- congenital defect.
Deviations
Violations in the duration of intervals and wave heights are also signs of changes in the functioning of the heart, on the basis of which a number of congenital and acquired pathologies can be diagnosed.
ECG indicatorsPossible pathologies
| P wave | |
| Pointed, greater than 2.5 mV | Congenital defect, coronary artery disease, congestive heart failure |
| Negative in lead I | Septal defects, pulmonary stenosis |
| Deep negative in V1 | Heart failure, myocardial infarction, mitral, aortic valve disease |
| PQ interval | |
| Less than 0.12 s | Hypertension, vasoconstriction |
| More than 0.2 s | Atrioventricular block, pericarditis, infarction |
| QRST waves | |
| In lead I and aVL there is a low R and deep S, as well as a small Q in the lead. II, III, aVF | Right ventricular hypertrophy, lateral myocardial infarction, vertical position of the heart |
| Late R in hole. V1-V2, deep S in hole. I, V5-V6, negative T | Ischemic disease, Lenegra disease |
| Wide serrated R in hole. I, V5-V6, deep S in hole. V1-V2, absence of Q in hole. I, V5-V6 | Left ventricular hypertrophy, myocardial infarction |
| Voltage below normal | Pericarditis, protein metabolism disorder, hypothyroidism |
Source: https://zabolevanija.net/ekg-rasshifrovka-norma-tablica/