A unique invention called an electrocardiograph has become a real lifeline for people susceptible to invisible but dangerous heart diseases. This medical device allows you to promptly identify serious pathology and prevent its further development.
At the end of the ECG procedure, in some cases the patient is given undeciphered data, which are visualized indicators of the functioning of the heart muscle. At this moment the person understands that he needs to know the result of the study. The article discusses one of the methods of self-deciphering, based on the study of the pathological q wave on the ECG.
Main components of a cardiogram
Before proceeding to the main part of the story, it is necessary to spend some time explaining certain aspects, the understanding of which will allow us to give an objective assessment of the studied data.
Pay attention to the depicted grid of 2 types of cells: small and large (5ˣ5). One horizontal side of a small cell corresponds to 1 mm or otherwise 0.04 seconds (time), and the vertical side corresponds to 1 mV (voltage in microvolts). Therefore, a large cell will be equal to 5 small cells or 0.2 seconds. The parameter in question may indicate a disturbance in the functioning of the heart, being one of the important elements of the cardiogram, but more on that later.
The teeth are areas that are located either above or below the midline (zero or isoelectric). In this case, the elevated segments are called positive, and those opposite them are called negative.
Features of the electrocardiogram
In medicine, there are 5 main teeth, which have their own designations in the form of Latin letters:
- P (normal: positive) indicates the time at which the heartbeat occurs, ideally should be equal to a period of 0.12-2 seconds. Let us recall the previously studied mesh structure of the electrocardiogram. It is easier to carry out calculations by marking the beginning and end of segment P with vertical lines.
- Q (normal: negative) determines the condition of the septum between the ventricles, indicating myocardial infarction.
- R (normal: positive) is usually located above the other teeth, representing the highest peak. Reflects changes in the area of the ventricular myocardium.
- S (normal: negative) is located, like Q, at the foot of the R peak and indicates the completion of processes occurring in the ventricles.
- T (normal: positive) represents the restoration of the potential of the heart muscle. It is usually located above the isoelectric (zero) line.
You cannot judge the state of the body’s “engine” by just one tooth: together, these elements will allow you to recreate a more detailed picture reflecting the state of the muscle.
But special attention will be paid to the “peak and its feet” - Q, R and S, which form the so-called QRS complex, made up of letter designations. The interval in which the QRS is located in a healthy person lasts up to 0.11-0.12 seconds. In rare cases, a chronological prolongation is observed, indicating pathology of the His bundle or a conduction disorder.
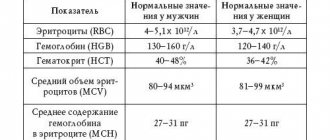
The ratio of the amplitudes of ECG waves in standard leads
• PQ interval - the time it takes for the impulse to pass from the beginning of atrial excitation to the beginning of ventricular excitation, including the physiological delay of the impulse in the AVU. From the beginning of the P wave to the beginning of the Q wave (or R, if there is no Q). See table.
• Prolongation of the PQ interval – with vagotonia, AVB.
• Shortening – with sympathicotonia, nodal rhythm, pre-excitation syndromes:
• WPW syndrome – PQ shortening, delta wave on the ascending limb of the R wave, QRS widening of more than 0.1 sec, discordant location of the main wave of the QRS complex and the T wave.
• PQ segment – part of the PQ interval from the end of the P wave to the beginning of the Q (that is, the PQ interval minus the P wave).
• Ventricular depolarization - ventricular QRST complex , reflecting:
• the process of excitation through the ventricles – QRS – the process of depolarization (see the table for the duration of the QRS interval),
• process of extinction of ventricular excitation ( repolarization ) – ST and T.
• QRS widening and R jaggedness – a sign of intraventricular blockade
• Left bundle branch block – split and widened QRS in the left leads and deep and widened S wave in the right leads.
• Right bundle branch block – changes in the R wave in the right leads and the S wave in the left leads.
• Incomplete right bundle branch block (RBBB) – in V1 and V2 there is a split R of normal width.
• The Q wave is always “-” (below the isoline), not constant, reflects the EMF of the interventricular septum and partially the apex of the RV. Formed at 0.01-0.02 seconds of the QRS complex. In the chest leads up to 1/2 R, in III - up to 1/3-1/4 R.
• The R wave is always “+”, reflects the EMF of the myocardium of the walls of the RV and LV, appears at 0.03-0.05 sec. QRS complex. Jaggedness of a low-amplitude R wave in one or two leads is not considered a pathology.
• The sum of the amplitudes of the R waves in three standard leads should be more than 15 mm; if less, a low-voltage ECG (for myocarditis, pericarditis, obesity).
• Most often RII > RIII > RI.
• By the predominance of the height of the R wave in leads I and III, it is determined what type of ECG it belongs to:
• RIII>RI – spelling.
• RI>RIII – levogram.
• To more correctly determine the type of ECG, consider the sum of the amplitudes R(+) and S(-) in standard lead I and the sum of amplitudes R(+) and S(-) in lead III.
• If the sum of the amplitudes is “+” in leads I and III, then the type of ECG is judged by comparing the obtained figures:
• > in lead III – pravogram.
• > in lead I – levogram.
• If the sum of “+” in lead III and “-” in lead I is a rightogram.
• If the sum of “+” in lead I and “-” in lead III is a levogram.
• The S wave is always negative, unstable, reflects the EMF of the myocardium of the basal parts of the heart, and is formed at 0.06-0.07 seconds of the QRS complex.
Feature of the Q wave
The Q wave is called pathological for a reason: it is its deviations from the norm that primarily indicate the presence of dangerous disorders in the heart muscle. The main part of them indicates myocardial vascular dysfunction.
Features of the physiological and pathological Q wave
In a normal state, q may not appear at all on the cardiogram, but if the wave makes itself felt, this does not mean that the patient is in danger. The segment in question, as a rule, lasts up to 0.03 seconds, no more. Its vertical part should in no case exceed ¼ of the height of the “rising peak” R. For example, with R equal to 12 mm, q cannot exceed (12mm/4) 3 mm.
What indicators indicate painful changes in the functioning of the heart?
To make a diagnosis, the doctor must see a number of changes on the ECG:
- the depth of the q wave must exceed a certain percentage of the amplitude of the QRS segment;
- in leads V5, V6 it is increased by more than 15%;
- in lead aVL – by 50% and I – by 10%, while this process occurs simultaneously;
- in lead aVF – by 25%;
- if PNPG block is diagnosed in leads V1, V2, then this wave may not exist at all;
- if an infarction of the anteroseptal region develops, then the R wave on the V1 segment can only remain due to continued excitation of the right ventricle.
Important! If the patient simultaneously develops a blockade of the PNPG and the Q wave grows in the area of V1 and V2, which has not previously shown itself, then there is no need to rush into staging a second infarction.
To clarify the diagnosis, the cardiologist must carefully evaluate the features of the QS complex if the patient has left ventricular hypertrophy. If the data is doubtful, then it is possible to use an ECG recording taking into account double amplification.
On the other hand, the QS complex will not play any role in the following ECG segments: aVR, III (if there are no changes in leads II and aVF), V1.
The q wave is a harbinger of danger
A little about the physiological manifestation of myocardial infarction. Since the artery has an impressive size, at the moment of colossal pressure on the walls of a large vessel, the atherosclerotic plaques located there leave their former habitat and begin to “bulge” into the inner part of the artery: a lumen gradually forms, significantly impeding the flow of blood.
Complete AV block on ECG
So, over time, certain areas begin to suffer from a lack of oxygen, which is transported to distant parts of the body by red blood cells, and the process of cell death occurs.
The initial stage (ischemia) is reversible, since there are no total disorders yet, but disruptions in the functioning of the heart are also visible. And with each subsequent day, ignoring warning symptoms destroys the already small chance of complete rehabilitation. At the end, scarring of the tissue occurs - an irreversible process.
Now let's return to the q wave: if an excessively deep q is visible on the cardiogram, this means that necrosis is already taking over the “engine” of the body. A long, jagged segment running downward is a very alarming sign. In such a case, a pronounced q can be observed, in comparison with which the positive R wave is absent.
Since in rare circumstances q can take on a menacing appearance for another reason, it is necessary to study the ST interval following the QRS complex: its suspicious modification will most likely become a guarantor of the appearance of MI.
An area of the heart muscle affected by necrosis tends to spread, “devouring” healthy cells
In addition, if the patient encounters the corresponding symptoms, the diagnosis is confirmed accurately:
- squeezing, squeezing pain felt behind the chest for 15-25 minutes;
- pain in the abdominal cavity;
- nausea, shortness of breath during physical activity;
- hyperhidrosis (excessive sweating);
- sudden attack of arrhythmia, loss of consciousness (short-term);
- severe weakness;
- unexpectedly low blood pressure.
How to detect signs of a heart attack on an ECG?
A doctor can speak accurately about the development of the disease only if the width of the prong is more than 0.04 s, and the depth is 25% higher than the amplitude of the protrusion R. A diagnosis can be made after analyzing the following changes:
- A change in the QRS segment (with loss of the R wave or its noticeable decrease), which is located in the center, indicates necrosis of myocardial tissue.
- Myocardial damage (changes of a lesser degree) are determined primarily by a change in the ST segment from being displaced relative to the isoline, and its arc turning towards the displacement.
- If a patient develops coronary heart disease, the polarity, amplitude and width of the T wave changes on the ECG.
Using an electrocardiogram, the doctor can determine the depth of necrosis of the heart muscle tissue.
Characteristics of waves at different stages of myocardial infarction
The pathology of a large vessel never occurs unexpectedly: it develops according to identified stages that ultimately lead the process of destruction to its logical conclusion. The table shows the characteristics of the cardiogram indicators relative to each stage.
| Stage | Duration | Signs |
| Early (ischemia) | From a few minutes to half an hour | Pointed T wave reaches height limit |
| Stage 1 (damage) | From several hours to 2-3 days | The ST rise is a dome-like elevation, the R wave is quite high, and q is still “small” |
| Stage 2 (acute) | From one to 3 weeks | ST subsides, but is still located above the isoline. Q deepens significantly, the T wave has become negative (bowl appearance) |
| Stage 3 (subacute) | From one to 2-3 months | Q and T reach a lower point and ST gradually approaches the zero line |
| Stage 4 (scarring) | From several months to an indefinite number of years | Q practically does not change its position. ST is on the midline, the “peak” R gradually decreased, T began to rise again in the form of a tubercle |
The electrocardiogram looks different in each case, as can be seen by looking at their external image.
Consecutive changes in the positions of the teeth with the further development of a dangerous disease
Negative consequences will bypass a person if, when alarming signs are detected, he promptly contacts a specialist who, upon completion of the diagnosis, will prescribe an individual treatment process. Myocardial infarction is a very serious disease that can cause death, so its manifestations cannot be ignored!
Possible errors in research
It is possible to obtain unreliable data from an electrocardiogram if the following factors influence the cardiograph when recording signals:
- alternating current frequency fluctuations,
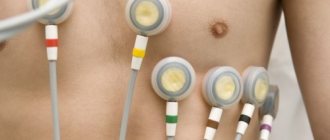
- displacement of the electrodes due to their loose application,
- muscle tremors in the patient's body.
All these points affect the obtaining of reliable data when conducting electrocardiography. If the ECG shows that these factors have taken place, the study is repeated.
When an experienced cardiologist interprets a cardiogram, a lot of valuable information can be obtained. In order not to trigger the pathology, it is important to consult a doctor when the first painful symptoms occur. This way you can save your health and life!