Tips and Recipes
The heart rate indicator on the ECG is considered the main one. From it, the doctor can determine whether the heart muscle is healthy. If the heart rate is less than 60 times per minute, this indicates developing bradycardia; more than 90 beats, this indicates tachycardia. Analysis of a cardiogram requires special skills, but any person can calculate the heart rate using standard calculation methods, checking the results with the indicators in the tables of norms.
How to count your pulse?
Different brands and models of electrocardiographs have different speeds for recording heart rate. The correct heart rate calculation is based on the speed characteristics of the devices.
Determination of heart rate becomes possible using the formula 60/RR, where 60 is seconds in a minute, and the R-R coefficient is the duration of the intervals between the teeth in seconds. When recording an electrocardiogram at a speed of 100 mm/s, 1 mm on the tape corresponds to a time period of 0.01 s, 5 mm = 0.1 s, 10 mm = 0.2 s. Calculating heart rate even for a person ignorant of medicine does not take more than 5 minutes. To determine deviations from normal values, you should check the indicators in the tables.
Age norms for heart rate
| Age, years | Minimum and maximum values, beats/min | Average values, beats/min |
| Up to 12 months | 102—162 | 132 |
| 1—2 | 94—155 | 124 |
| 3—6 | 86—126 | 106 |
| 6—8 | 78—118 | 98 |
| 8—10 | 68—108 | 88 |
| 10—12 | 60—100 | 80 |
| 12—15 | 50—90 | 75 |
| Up to 50 | 60—75 | 73 |
| 50—60 | 70—85 | 75 |
| 60—80 | 70—90 | 80 |
Return to contents
What does it represent?
An electrocardiogram measures the electrical activity of the heart muscle, or the potential difference between two points. The mechanism of the heart is described in the following stages:
When the heart muscle is not contracting, the structural units of the myocardium have a positively charged cell membrane and a negatively charged core. As a result, the ECG machine draws a straight line. The conduction system of the heart muscle generates and distributes excitation or electrical impulse. Cell membranes take over this impulse and move from a state of rest to excitation. Cell depolarization occurs—that is, the polarity of the inner and outer membranes changes. Some ion channels open and potassium and magnesium ions change places throughout the cells. After a short period of time, the cells return to their previous state, returning to their original polarity. This phenomenon is called repolarization.
In a healthy person, excitement causes the heart to contract, and recovery relaxes it. These processes are reflected on the cardiogram by teeth, segments and intervals.
Return to contents
How is it carried out?
The electrocardiography method helps to study the condition of the heart.
An electrocardiogram is performed as follows:
The patient in the doctor’s office takes off his outer clothing, frees his shins, and lies on his back. The doctor treats the electrode fixation sites with alcohol. Cuffs with electrodes are attached to the ankles and certain areas of the arms. The electrodes are attached to the body in a strict sequence: a red electrode is attached to the right arm, a yellow one - to the left. A green electrode is fixed on the left leg, black color refers to the right leg. Several electrodes are fixed on the chest. The ECG recording speed is 25 or 50 mm per second. During the measurements, the person lies quietly, the doctor controls his breathing. Return to contents
Heart rate on ECG
The heart rate indicator on the ECG is considered the main one. From it, the doctor can determine whether the heart muscle is healthy.
If the heart rate is less than 60 times per minute, this indicates developing bradycardia; more than 90 beats, this indicates tachycardia.
Analysis of a cardiogram requires special skills, but any person can calculate the heart rate using standard calculation methods, checking the results with the indicators in the tables of norms.
What does it represent?
An electrocardiogram measures the electrical activity of the heart muscle, or the potential difference between two points. The mechanism of the heart is described in the following stages:
- When the heart muscle is not contracting, the structural units of the myocardium have a positively charged cell membrane and a negatively charged core. As a result, the ECG machine draws a straight line.
- The conduction system of the heart muscle generates and distributes excitation or electrical impulse. Cell membranes take over this impulse and move from a state of rest to excitation. Cell depolarization occurs—that is, the polarity of the inner and outer membranes changes. Some ion channels open, and potassium and magnesium ions change places throughout the cells.
- After a short period of time, the cells return to their previous state, returning to their original polarity. This phenomenon is called repolarization.
In a healthy person, excitement causes the heart to contract, and recovery relaxes it. These processes are reflected on the cardiogram by teeth, segments and intervals.
How is it carried out?
The electrocardiography method helps to study the condition of the heart.
An electrocardiogram is performed as follows:
- The patient in the doctor's office takes off his outer clothing, frees his legs, and lies on his back.
- The doctor cleans the electrode fixation sites with alcohol.
- Cuffs with electrodes are attached to the ankles and certain areas of the arms.
- The electrodes are attached to the body in a strict sequence: a red electrode is attached to the right hand, a yellow electrode is attached to the left. A green electrode is fixed on the left leg, black color refers to the right leg. Several electrodes are fixed on the chest.
- ECG recording speed is 25 or 50 mm per second. During the measurements, the person lies quietly, and the doctor controls his breathing.
ECG elements
Several consecutive teeth are combined into intervals. Each tooth has a specific meaning, marking and classification:
- P - designation of the tooth, which records how much the atria have contracted;
- Q, R, S - 3 teeth that record the contraction of the ventricles;
- T - shows the degree of relaxation of the ventricles;
- U is not always a fixed tooth.
Q, R, S are the most important indicators. Normally, they go in order: Q, R, S. The first and third tend downward, as they indicate excitation of the septum. The Q wave is especially important, since if it is widened or deepened, this indicates necrosis of certain areas of the myocardium.
The remaining teeth in this group, directed vertically, are designated by the letter R. If their number is more than one, this indicates pathology. R has the greatest amplitude and is best distinguished during normal heart function.
In case of illness, this tooth stands out weakly and is not visible in some cycles.
A segment is an interdental straight isoline. The maximum length is fixed between the ST and PQ teeth. Impulse delay occurs in the atrioventricular node. A straight PQ isoline appears. An interval is considered to be a section of a cardiogram containing a segment and waves. The values of the QT and PQ intervals are considered to be the most responsible.
Table of normal values for adults
| Index | Norm, seconds |
| Q, R, S | 0,06—0,1 |
| P | 0,01—0,11 |
| Q | 0,03 |
| T | 0,12—0,28 |
| PQ | 0,12—0,2 |
| Heart rate | 60—90 |
Decoding the results
The electrocardiogram is recorded on a special paper tape.
Determination of the main indicators of an ECG recording is carried out according to the following scheme:
- Conductivity and rhythm are analyzed. The doctor has the opportunity to calculate and analyze the regularity of heart contractions using the ECG. Then he calculates heart rate, finds out what caused the excitation and evaluates conductivity.
- It is determined how the heart is rotated relative to the longitudinal, transverse and anteroposterior axes. The electrical axis is determined in the anterior plane, as well as the rotation of the heart muscle around the longitudinal and transverse lines.
- The P wave is calculated and analyzed.
- The doctor analyzes the QRST complex in the following order: QRS complex, size of the RS-T segment, position of the T wave, duration of the Q-T interval.
Normally, the segments between the tops of the R waves of adjacent complexes should correspond to the intervals between the P waves. This indicates a sequential contraction of the heart muscle and the same frequency of the ventricles and atria. If this process is disrupted, arrhythmia is diagnosed.
How is heart rate calculated?
To calculate the number of heartbeats, the doctor divides the length of the tape per minute by the distance between the R waves in millimeters. The length of the minute recording is 1500 or 3000 mm. The measurements are recorded on graph paper, a cell contains 5 mm, and this length is equal to 300 or 600 cells.
The method for quickly calculating heart rate is based on the formula heart rate = 600 (300) mm/distance between teeth . The disadvantage of this method of calculating heart rate: in a healthy person, the heart rate deviation is up to 10%. If the patient has an arrhythmia, this error increases significantly.
In such cases, the doctor calculates the average of several measurements.
Another method for calculating heart rate = 60/RR, where 60 is the number of seconds, RR is the interval time in seconds.
This method requires concentration and time from the specialist, which is not always feasible in a clinic or hospital. Normal heart rate is 60-90 beats.
If the pulse is too high, tachycardia is diagnosed. Contractions less than 60 times per minute indicate bradycardia.
Source: //EtoDavlenie.ru/puls/kak-poschitat-chss-po-ekg.html
ECG elements
Several consecutive teeth are combined into intervals. Each tooth has a specific meaning, marking and classification:
P - designation of a tooth that records how much the atria have contracted; Q, R, S - 3 teeth that record the contraction of the ventricles; T - shows the degree of relaxation of the ventricles; U - a tooth that is not always fixed.
Q, R, S are the most important indicators. Normally, they go in order: Q, R, S. The first and third tend downward, as they indicate excitation of the septum. The Q wave is especially important, since if it is widened or deepened, this indicates necrosis of certain areas of the myocardium. The remaining teeth in this group, directed vertically, are designated by the letter R. If their number is more than one, this indicates pathology. R has the greatest amplitude and is best distinguished during normal heart function. In case of illness, this tooth stands out weakly and is not visible in some cycles.
A segment is an interdental straight isoline. The maximum length is fixed between the ST and PQ teeth. Impulse delay occurs in the atrioventricular node. A straight PQ isoline appears. An interval is considered to be a section of a cardiogram containing a segment and waves. The values of the QT and PQ intervals are considered to be the most responsible.
Return to contents
Decoding the results
The electrocardiogram is recorded on a special paper tape.
Determination of the main indicators of an ECG recording is carried out according to the following scheme:
Conductivity and rhythm are analyzed. The doctor has the opportunity to calculate and analyze the regularity of heart contractions using the ECG. Then he calculates the heart rate, finds out what caused the excitation and evaluates conductivity. It is determined how the heart is rotated relative to the longitudinal, transverse and anteroposterior axes. The electrical axis is determined in the anterior plane, and at the same time the rotations of the heart muscle near the longitudinal and transverse lines. The P wave is calculated and analyzed. The doctor analyzes the QRST complex in the following order: QRS complex, size of the RS-T segment, position of the T wave, duration of the Q interval -T.
Normally, the segments between the tops of the R waves of adjacent complexes should correspond to the intervals between the P waves. This indicates a sequential contraction of the heart muscle and the same frequency of the ventricles and atria. If this process is disrupted, arrhythmia is diagnosed.
Return to contents
ECG analysis
General scheme of ECG decoding
- Checking the correctness of ECG registration.
- Heart rate and conduction analysis:
- assessment of heart rate regularity,
- heart rate (HR) counting,
- determination of the source of excitation,
- conductivity assessment.
- Determination of the electrical axis of the heart.
- Analysis of the atrial P wave and P–Q interval.
- Analysis of the ventricular QRST complex:
- QRS complex analysis,
- analysis of the RS – T segment,
- T wave analysis,
- Q-T interval analysis.
Normal electrocardiogram.
1) Checking the correct ECG registration
At the beginning of each ECG tape there must be a calibration signal - the so-called reference millivolt . To do this, at the beginning of the recording, a standard voltage of 1 millivolt is applied, which should display a deviation of 10 mm .
Without a calibration signal, the ECG recording is considered incorrect. Normally, in at least one of the standard or enhanced limb leads, the amplitude should exceed 5 mm , and in the chest leads - 8 mm .
If the amplitude is lower, this is called reduced ECG voltage , which occurs in some pathological conditions.
Control millivolt on the ECG (at the beginning of the recording).
2) Heart rate and conduction analysis:
- assessment of heart rate regularity
Rhythm regularity is assessed by RR intervals . If the teeth are at an equal distance from each other, the rhythm is called regular, or correct. The spread of the duration of individual RR intervals is allowed no more than ± 10% of their average duration. If the rhythm is sinus, it is usually regular.
- heart rate (HR)
The ECG film has large squares printed on it, each of which contains 25 small squares (5 vertical x 5 horizontal). To quickly calculate heart rate with the correct rhythm, count the number of large squares between two adjacent R-R waves.
At a belt speed of 50 mm/s: HR = 600 / (number of large squares). At a belt speed of 25 mm/s: HR = 300 / (number of large squares).
On the overlying ECG, the RR interval is approximately 4.8 large cells, which at a speed of 25 mm/s gives 300 / 4.8 = 62.5 beats/min.
At a speed of 25 mm/s, each small cell is equal to 0.04 s , and at a speed of 50 mm/s - 0.02 s . This is used to determine the duration of the teeth and intervals.
If the rhythm is abnormal, the maximum and minimum heart rate according to the duration of the shortest and longest RR interval, respectively.
- determination of the excitation source
In other words, they are looking for where the pacemaker , which causes contractions of the atria and ventricles.
Sometimes this is one of the most difficult stages, because various disorders of excitability and conduction can be very confusingly combined, which can lead to incorrect diagnosis and incorrect treatment.
To correctly determine the source of excitation on an ECG, you need to have a good knowledge of the conduction system of the heart .
SINUS rhythm (this is a normal rhythm, and all other rhythms are pathological). The source of excitation is located in the sinoatrial node . Signs on the ECG:
- in standard lead II, the P waves are always positive and are located before each QRS complex,
- P waves in the same lead have the same shape at all times.
P wave in sinus rhythm.
ATRIAL rhythm . If the source of excitation is located in the lower parts of the atria, then the excitation wave propagates to the atria from bottom to top (retrograde), therefore:
- in leads II and III the P waves are negative,
- There are P waves before each QRS complex.
P wave during atrial rhythm.
Rhythms from the AV connection . If the pacemaker is located in the atrioventricular ( atrioventricular node ) node, then the ventricles are excited as usual (from top to bottom), and the atria are excited retrogradely (i.e. from bottom to top). At the same time, on the ECG:
- P waves may be absent because they are superimposed on normal QRS complexes,
- P waves can be negative, located after the QRS complex.
Rhythm from the AV junction, superimposition of the P wave on the QRS complex.
Rhythm from the AV junction, the P wave is located after the QRS complex.
Heart rate with a rhythm from the AV junction is less than sinus rhythm and is approximately 40-60 beats per minute.
Ventricular, or IDIOVENTRICULAR, rhythm (from Latin ventriculus [ventrikulyus] - ventricle). In this case, the source of rhythm is the ventricular conduction system. Excitation spreads through the ventricles in the wrong way and is therefore slower. Features of idioventricular rhythm:
- QRS complexes are widened and deformed (they look “scary”). Normally, the duration of the QRS complex is 0.06-0.10 s, therefore, with this rhythm, the QRS exceeds 0.12 s.
- There is no pattern between QRS complexes and P waves because the AV junction does not release impulses from the ventricles, and the atria can be excited from the sinus node, as normal.
- Heart rate less than 40 beats per minute.
Idioventricular rhythm. The P wave is not associated with the QRS complex.
- conductivity assessment . To properly account for conductivity, the recording speed is taken into account.
To assess conductivity, measure:
- the duration of the P wave (reflects the speed of impulse transmission through the atria), normally up to 0.1 s .
- duration of the P – Q interval (reflects the speed of impulse conduction from the atria to the ventricular myocardium); interval P – Q = (wave P) + (segment P – Q). Normally 0.12-0.2 s .
- duration of the QRS complex (reflects the spread of excitation through the ventricles). Normally 0.06-0.1 s .
- interval of internal deviation in leads V1 and V6. This is the time between the beginning of the QRS complex and the R wave. Normally in V1 up to 0.03 s and in V6 up to 0.05 s . It is used mainly to recognize bundle branch blocks and to determine the source of excitation in the ventricles in the case of ventricular extrasystole (extraordinary contraction of the heart).
Measuring the internal deviation interval.
3) Determination of the electrical axis of the heart . In the first part of the ECG series, it was explained what the electrical axis of the heart and how it is determined in the frontal plane.
4) Analysis of the atrial P wave . Normally, in leads I, II, aVF, V2 – V6, the P wave is always positive . In leads III, aVL, V1, the P wave can be positive or biphasic (part of the wave is positive, part is negative). In lead aVR, the P wave is always negative.
Normally, the duration of the P wave does not exceed 0.1 s , and its amplitude is 1.5 – 2.5 mm.
Pathological deviations of the P wave:
- Pointed high P waves of normal duration in leads II, III, aVF are characteristic of right atrium hypertrophy , for example, with “cor pulmonale”.
- Split with 2 apexes, widened P wave in leads I, aVL, V5, V6 is characteristic of left atrium hypertrophy , for example, with mitral valve defects.
Formation of the P wave (P-pulmonale) with hypertrophy of the right atrium.
Formation of the P wave (P-mitrale) with left atrial hypertrophy.
PQ interval : normal 0.12-0.20 s . An increase in this interval occurs when the conduction of impulses through the atrioventricular node is impaired ( atrioventricular block , AV block).
There are 3 degrees of AV block
- I degree – the PQ interval is increased, but each P wave corresponds to its own QRS complex ( there is no loss of complexes ).
- II degree – QRS complexes partially fall out , i.e. Not all P waves have their own QRS complex.
- III degree – complete blockade of conduction in the AV node. The atria and ventricles contract at their own rhythm, independently of each other. Those. idioventricular rhythm occurs.
5) Ventricular QRST analysis:
The maximum duration of the ventricular complex is 0.07-0.09 s (up to 0.10 s). The duration increases with any bundle branch block.
Normally, the Q wave can be recorded in all standard and enhanced limb leads, as well as in V4-V6. The amplitude of the Q wave normally does not exceed 1/4 of the height of the R wave , and the duration is 0.03 s . In lead aVR, there is normally a deep and wide Q wave and even a QS complex.
The R wave, like the Q wave, can be recorded in all standard and enhanced limb leads. From V1 to V4, the amplitude increases (while the rV1 wave may be absent), and then decreases in V5 and V6.
The S wave can have very different amplitudes, but usually no more than 20 mm. The S wave decreases from V1 to V4, and may even be absent in V5-V6. In lead V3 (or between V2 – V4), a “ transition zone ” is usually recorded (equality of the R and S waves).
The ST segment (RS-T) is the segment from the end of the QRS complex to the beginning of the T wave. The ST segment is especially carefully analyzed in case of coronary artery disease, as it reflects the lack of oxygen (ischemia) in the myocardium.
Normally, the ST segment is located in the limb leads on the isoline ( ± 0.5 mm ). In leads V1-V3, the ST segment may shift upward (no more than 2 mm), and in leads V4-V6 - downward (no more than 0.5 mm).
The transition point of the QRS complex to the ST segment is called point j (from the word junction - connection). The degree of deviation of point j from the isoline is used, for example, to diagnose myocardial ischemia.
The T wave reflects the process of repolarization of the ventricular myocardium. In most leads where a high R is recorded, the T wave is also positive. Normally, the T wave is always positive in I, II, aVF, V2-V6, with TI > TIII, and TV6 > TV1. In aVR the T wave is always negative.
The QT interval is called electrical ventricular systole because at this time all parts of the ventricles of the heart are excited. Sometimes after the T wave a small U wave , which is formed due to short-term increased excitability of the ventricular myocardium after their repolarization.
6) Electrocardiographic report . Should include:
- Source of rhythm (sinus or not).
- Regularity of rhythm (correct or not). Usually sinus rhythm is normal, although respiratory arrhythmia is possible.
- Heart rate.
- Position of the electrical axis of the heart.
- Presence of 4 syndromes:
- rhythm disturbance
- conduction disturbance
- hypertrophy and/or overload of the ventricles and atria
- myocardial damage (ischemia, dystrophy, necrosis, scars)
Examples of conclusions (not entirely complete, but real):
Sinus rhythm with heart rate 65. Normal position of the electrical axis of the heart. No pathology was identified.
Sinus tachycardia with heart rate 100. Single supraventricular extrasystole.
Sinus rhythm with heart rate 70 beats/min. Incomplete blockade of the right bundle branch. Moderate metabolic changes in the myocardium.
Examples of ECG for specific diseases of the cardiovascular system - next time.
Didn't find what you were looking for? Use the search:
Source: https://studopedia.ru/15_81105_analiz-ekg.html
How is heart rate calculated?
To calculate the number of heartbeats, the doctor divides the length of the tape per minute by the distance between the R waves in millimeters. The length of the minute recording is 1500 or 3000 mm. The measurements are recorded on graph paper, a cell contains 5 mm, and this length is equal to 300 or 600 cells. The method for quickly calculating heart rate is based on the formula heart rate = 600 (300) mm/distance between teeth . The disadvantage of this method of calculating heart rate: in a healthy person, the heart rate deviation is up to 10%. If the patient has an arrhythmia, this error increases significantly. In such cases, the doctor calculates the average of several measurements.
Another method for calculating heart rate = 60/RR, where 60 is the number of seconds, RR is the interval time in seconds. This method requires concentration and time from the specialist, which is not always feasible in a clinic or hospital. Normal heart rate is 60-90 beats. If the pulse is too high, tachycardia is diagnosed. Contractions less than 60 times per minute indicate bradycardia.
It is important to know! An effective remedy for normalizing heart function and cleaning blood vessels exists! ...
One of the most important indicators of heart health is the number of heartbeats (HR) per minute. Let's get acquainted with methods for calculating heart rate on an ECG.
Before analyzing the electrocardiogram, you must ensure that the cardiograph is working correctly. When taking an ECG, interference may occur, for example, due to poor contact of the electrodes with the skin, muscle tremors or induced currents. Distortion can also occur due to uneven paper movement. In all these cases, the cardiogram should be retaken.
How to calculate heart rate from an ECG?
An electrocardiogram is an instrumental technique that is widely used in the clinic of internal medicine. Heart rate on an ECG can be quickly determined by the cells on the recording tape. This skill does not require any mathematical sophistication or medical practice. It is available to every patient. To calculate the rhythm, heart axis and other informative indicators, use a special ruler. Every general practitioner and cardiologist is equipped with the necessary equipment to measure and interpret electrocardiogram data. But even patients find it useful to know how to calculate heart rate using their own tape.
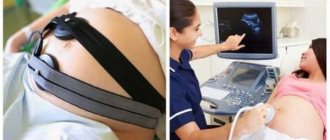
The essence of the procedure
The heart rate is recorded on tape when an ECG is taken with a special device. In order to do this, special clothespins are placed on the patient’s arms and legs. If the chest leads are determined, 7 suction cups are installed on the chest. A 12-lead recording is used as standard. An electrocardiogram is the determination of heart rhythm by recording impulses from the surface of the chest. The speed of ECG recording depends on the individual characteristics of the device. It is 50 or 25 mm/sec. Further calculation of heart rate is based on it. It is produced using cellular and combined methods. The first of them is used for rhythmic heart contractions, the second allows you to calculate heart rate for arrhythmias.
Method "by cells"
Its essence is to use the tape recording speed and the distance between the cardiac complexes in millimeter values in the formula for calculating the tape recording speed. The R wave is taken as the starting point for the latter. For example, if the electrocardiogram recording speed was 25 mm/sec, this is equal to 300 millimeter tape cells. The minute record has a total distance of 1500 mm, since each cell is equal to 5 millimeters. This method of counting is appropriate for rhythmic heartbeats. If the patient has an arrhythmia, the distance between the teeth R will be different and the calculation results will become unreliable.
Combined technique
It consists of counting the number of heartbeats, which is taken as the length of the recording per minute. It is multiplied by the quantitative value of the intervals between R-waves. The resulting numbers are divided by the total interval length. 3 teeth are always 2 intervals between them. For example, this distance is 20 cells of 5 mm each. If the electrocardiogram was recorded at a speed of 25 mm/sec, heart rate is calculated by multiplying 300 by 2 and dividing the resulting product by 20. If the sum of 3 intervals does not exceed 22 cells, the patient has tachycardia. When it is more than 30 cells, the patient has bradycardia.
How is the technique carried out?
The electrocardiogram is recorded in the manipulation room. This is performed in an outpatient clinic by a general practitioner, and in a hospital by a cardiologist. To perform the procedure correctly, the patient lies down on the couch. His hands above the wrist, legs around the ankles and chest are lubricated with a special solution for better contact of the electrodes. Then suction cups are placed on the chest. A red clothespin is put on the right hand, and a yellow one on the left. Their distribution follows the traffic light principle. The doctor puts a green clothespin on the left leg and a black one on the right leg. Heart rate is calculated using a formula that takes into account the recording speed on the tape and the distance in mm between the teeth. One cell is 0.02 seconds. This value is contained in the calculation table.
A little theory
The electrocardiogram shows a reflection of the electrical processes occurring in the heart. They are called depolarization (excitation) and repolarization (restoration) of myocardial cells. Normally, excitation leads to contraction, and recovery leads to relaxation of the muscle. When analyzing a cardiogram, its elements are highlighted, such as teeth, that is, deviations of the line up or down, and the segments connecting them, on which the cardiograph draws a straight line. One or a group of teeth together with the segment following them is called an interval.
The waves are associated with the contraction or relaxation of one of the heart muscles. There are:
the wave associated with atrial contraction is designated by the letter P; The 3 waves associated with ventricular contraction are designated Q, R and S; relaxation of the ventricles corresponds to a wave designated by the letter T; sometimes a non-permanent tooth, designated by the letter U, is also recorded.
The most important are the 3 waves associated with the massive ventricular myocardium. The first of them is designated Q, S normally comes after R. The Q and S waves are associated with the excitation of the septum between the ventricles and are directed downward. Particular attention is paid to the Q wave because its expansion and deepening is caused by the necrosis of areas of the myocardium. All teeth of the group directed upward are designated by the letter R. In pathologies there may be several of them.
Normally, the R wave corresponds to the contraction of the ventricle. Having the greatest amplitude, it easily stands out on the cardiogram of a healthy heart. If the heart is malfunctioning, then the R wave is not so clearly visible and may even be absent in some cycles altogether. In this case, QS waves should be taken into account instead of R.
How to diagnose atrial fibrillation using an ECG
Fibrillation is characterized by a tachyarrhythmia-like heartbeat, rapid, irregular pulse and heart contractions. Most patients experience chest trembling and weakness. A distinctive symptom is an inconsistent pulse. But sometimes atrial fibrillation is asymptomatic, and therefore an electrocardiogram is considered the standard method for detecting heart rhythm disturbances.
The main signs of atrial fibrillation on the ECG (photo 1):
- P waves are not recorded in all 12 leads, since the impulses pass chaotically through the atria;
- small random f waves are determined, most often recorded in leads V1, V2, II, III and aVF;
- ventricular QRS complexes become irregular, a change in the frequency and duration of the R-R intervals is observed, AV block is detected against the background of a low frequency of ventricular contraction - bradyform fibrillation;
- QRS complexes do not change, without deformation or widening.
Photo 1: Example of an ECG with atrial fibrillation.
Arrhythmia is manifested by rapid or slow contraction of the heart. Atrial fibrillation on the ECG is divided into two types:
- in the tachysystolic variant, electrocardiography reflects a heart contraction of more than 90 beats per minute (photo 2);
Photo 2: Tachysystolic form of AF.
- bradysystolic variant - contractions less than 60 beats per minute. (Fig. 3);
Photo 3: Bradysystolic form of AF.
With arrhythmia, contractions arise from different sections of muscle fibers, ectopic foci, as a result of which there is no single contraction of the atria. Against the background of hemodynamic failure, the right and left ventricles receive insufficient blood volume, cardiac output decreases, which determines the severity of the disease. Decoding the cardiogram helps to establish the exact heart rhythm disorder.
A characteristic sign of fibrillation on the ECG is f waves (large-wave and small-wave):
- in the first case, fibrillation is determined by large waves, atrial fibrillation reaches 300-500 per minute;
- in the second, the flicker waves become small, reaching 500-700 per minute.
Atrial flutter is a variant of slower contraction of the heart muscle, in the range of 200-300 beats per minute. Patients with persistent atrial fibrillation experience frequent flutter recurrences. Such an emergency requires urgent medical attention.
Analysis of cases of paroxysms shows that on average, in 10% of patients, an attack of atrial fibrillation turns into flutter, which is determined on the ECG in the form of the following description:
- the absence of P waves and the replacement of small f waves with large sawtooth waves F is the main characteristic, which is presented in photo 4;
- normal ventricular QRS complexes.
The essence of the technique
The electrocardiogram is usually recorded at a speed of 50 or 25 mm/sec. To calculate the number of heart beats per minute, you need to divide the length of the tape, which would correspond to a minute record (3000 mm or 1500 mm, respectively) by the distance in millimeters between two R-type teeth. Since the cardiogram is printed on a millimeter tape, it is convenient to calculate the distance in large cells with a side length of 5 mm. The length of the minute record in cells is 600 (or 300 if the speed is 25 mm/sec), so the heart rate is calculated as 600 (or 300) divided by the distance between the teeth.
However, this method of calculation has a significant flaw. Although a healthy heart beats rhythmically, the distance between two R waves can vary by up to 10%. If arrhythmia is noted, then the deviations can be significantly greater. In this case, the average distance between the teeth is used to calculate the contraction frequency. To calculate it, you need to measure the distance between a certain number of teeth and divide by the number of intervals between them.
Attention! If you take 4 teeth, then there are 3 intervals between them, that is, there is always one less.
Lesson 2 (sinus-non-sinus) – e-cardio
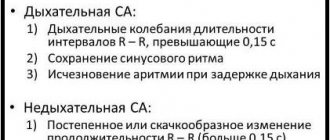
Considering that there are a lot of violations, we will focus only on the most basic ones, but first you need to learn to distinguish sinus rhythm from non-sinus rhythm. To do this, you need to remember, write down (who needs it) the signs of sinus rhythm.
- The presence in leads II (and usually aVF) of positive, identically shaped P waves, located at the same distance from the QRS complex in all complexes (heartbeats).
- Heart rate (I’ll tell you how to determine it later) from 60 to 100 per minute (less is bradycardia , more is tachycardia .).
- The difference between the largest and smallest RR intervals (more on intervals later) should not exceed 10%. (however, this rule only applies if the heart rate is more than 60 per minute, that is, if there is no sinus bradycardia)
As you may have guessed, to understand rhythm you need to talk about how to determine the frequency of the rhythm and intervals.
ECG INTERVALS (now we are only interested in RR)
This diagram more than clearly demonstrates how to measure the RR interval.
Note: Intervals are measured in milliseconds, for example: 750 ms or 0.75 s, but we will use a simpler method.
Knowing how to measure the RR interval, we can determine the heart rate (HR)
DETERMINATION OF HEART RATE
Regardless of the type of ECG device, the recording always contains small cells of 1×1 mm and large cells of 5×5 mm, and the speed of the tape is also indicated (this is important!), usually 50 mm/s. or 25 mm/s.
At belt speed 50 mm/s:
HR = 600 / (number of large squares between two RRs (RR interval); or HR = 3000 / (number of small squares) .
At belt speed 25 mm/s:
HR = 300/(number of large squares between two RRs (RR intraval); or 1500/(number of small squares).
Here it would be appropriate to give a little additional information about the ECG waves.
Each wave on an ECG has two characteristics: amplitude and duration.
The amplitude is expressed in mV (millivolts), usually one mV corresponds to ten mm or 10 small cells.
The duration is expressed in seconds (less often milliseconds), so one cell in a standard ECG recording (tape speed 50 mm/s) is equal to 0.02 s. When recording at a speed of 25 mm/s, one small cell is equal to 0.04 s.
Let's try to use this formula together (by the way, it was not taken from our heads, but is derived mathematically, but let's not talk about that)
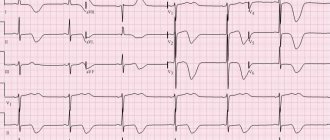
EXAMPLE ECG No. 1
CALCULATION: tape speed is 50 mm/s, select any lead where there are high R waves, let it be II.
We take the first RR - it is equal to almost 9 large cells, which means: heart rate = 600/9 = 66 beats. per minute
Or, RR is equal to 45 small cells, then: heart rate = 3000/45 = 66 beats. per minute That's all.
As you can see, the numbers almost coincided with those calculated by the computer; this technique is used to determine heart rate “by eye.” In practice, it is convenient to use special cardiac rulers.
But let's make it more difficult.
Example ECG No. 2
As you can see, the rhythm frequency varies from 63 to 84, what should you do in this case?
The easiest way is to take 3-4 intervals and find the arithmetic mean, that is: (59+64+80+84)/4 = 72 beats. per minute
At this point, we will consider the topic “heart rate” closed, and we return to our plan, namely:
We are a little distracted from the plan, if you remember (who doesn’t remember, let’s go up) one of the signs of sinus rhythm is:
The presence in leads II and aVF of predominantly positive, identically shaped P waves, located at the same distance from the QRS in all complexes (heartbeats).
Let's look at an example:
Example ECG No. 3
As you can see, in leads II, AVF, positive P waves of the same shape are quite clearly defined. They are also located at the same distance from the ventricular QRS complex (in this case there is no S wave, therefore qR) are marked with black markers. The first condition is met.
Second condition : heart rate = 60-100 per minute. As you can see, the frequency here is about 68-70 rpm. Done
The third condition is that the difference between the two RRs does not exceed 10%. What does it mean? Return to ECG No. 2, on it the rhythm frequency varied from 59 to 84, that is, the difference between the two numbers (84-59) = 25.
In order to understand what this difference looks like in percentage, you need to create a proportion: (100 × 25/84) = 29% (direct proportion, school curriculum), which means the third condition is not met and ECG No. 2 does not show sinus rhythm.
When all conditions are met, but the RR difference exceeds 10%, this is called sinus arrhythmia.
On our ECG No. 3, the difference is only 70-65 = 5, which corresponds to 8% (although this is visible without calculations or ... will be visible to you over time). The third condition is met. In any case, you can't really go wrong if you ignore this difference. This is not the biggest mistake.
Thus, ECG 3 shows sinus rhythm.
In general, we have covered enough here for you to start trying to determine ri yourself. Let's move on to training.
Complete task 2.1 “sinus-non-sinus”
If you find any error, please select a piece of text and press “ Ctrl+Enter”
Source: https://e-cardio.ru/vvodnyj-kurs-ekg/urok2/
Combined calculation
But then the calculations will require two operations - first, calculating the average distance between the teeth, and then the actual determination of the heart rate. However, these operations can be easily combined. In this case, the number of abbreviations is calculated as the length of a minute record in selected units, multiplied by the number of intervals and divided by their total length. If you take it as a rule to count the distance between a certain number of teeth, then from this it is easy to estimate the required value.
Let the distance between 4 teeth (3 intervals), at a speed of 50 mm per second, be 30 cells of 5 mm each. Then the heart rate will be equal to 600, multiplied by 3 and divided by 30, that is, 60 per minute. If this distance is equal to 22 cells, then the frequency of contractions will be approximately 82. Having remembered the distances of 22 and 30 cells (11 and 15 cells if the speed is 25 mm/sec), you can immediately conclude that the heart rate corresponds to the norm. Looking ahead a little, you can see that for an adult, the distance between 4 teeth of less than 22 cells will correspond to tachycardia, and more than 30 - bradycardia.
Types of atrial fibrillation and an example of a diagnosis
Clinically, atrial fibrillation manifests itself in several forms:
- paroxysmal, when an attack of fibrillation lasts no more than 48 hours in the case of successful treatment (cardioversion), or paroxysm is restored within 7 days;
- persistent - arrhythmia lasts more than a week, or fibrillation can be eliminated later than 48 hours with drug therapy and electrical stimulation;
- permanent form, when chronic fibrillation is not eliminated by cardioversion. Drug assistance in this case is ineffective.
Taking into account the heart rate data and signs of typical atrial fibrillation on the ECG, three variants of fibrillation are determined:
- normosystolic form - heart rate within 60-100 beats per minute;
- tachysystolic - heart rate more than 90 beats per minute;
- bradysystolic - heart rate less than 60 beats per minute.
The clinical diagnosis of the patient includes the characteristics of the arrhythmia and ECG data, which are deciphered: atrial fibrillation, persistent form, tachysystolic variant.
Normal limits
For an adult at rest, exactly 60 and 80 contractions per minute are considered normal limits. The exception is professional athletes and people doing heavy physical work, whose heart rate can drop to 40. A low heart rate can also be associated with the constitution of the body; in these cases, it usually has a familial nature.
In a newborn, a contraction frequency ranging from 110 to 170 beats per minute is considered normal; in children under one year of age, it decreases to 100-160. For six-year-olds, the normal limits are considered to be 85 and 125, and for children 12 years old - 60 and 100 contractions per minute.
Are you suffering from heart pain?
“How to simply cleanse blood vessels and get rid of chest pain . A proven method - write down the recipe...!” >>
An upward deviation from the norm is called tachycardia, and a downward deviation is called bradycardia. Temporary tachycardia occurs during any physical and psychological stress and even when eating. Under very heavy loads, the heart rate can reach up to 200. When the load stops, the heartbeat gradually returns to normal.
How to diagnose atrial fibrillation using an ECG
Fibrillation is characterized by a tachyarrhythmia-like heartbeat, rapid, irregular pulse and heart contractions. Most patients experience chest trembling and weakness. A distinctive symptom is an inconsistent pulse. But sometimes atrial fibrillation is asymptomatic, and therefore an electrocardiogram is considered the standard method for detecting heart rhythm disturbances.
The main signs of atrial fibrillation on the ECG (photo 1):
- P waves are not recorded in all 12 leads, since the impulses pass chaotically through the atria;
- small random f waves are determined, most often recorded in leads V1, V2, II, III and aVF;
- ventricular QRS complexes become irregular, a change in the frequency and duration of the R-R intervals is observed, AV block is detected against the background of a low frequency of ventricular contraction - bradyform fibrillation;
- QRS complexes do not change, without deformation or widening.
Photo 1: Example of an ECG with atrial fibrillation.
Arrhythmia is manifested by rapid or slow contraction of the heart. Atrial fibrillation on the ECG is divided into two types:
- in the tachysystolic variant, electrocardiography reflects a heart contraction of more than 90 beats per minute (photo 2);
Photo 2: Tachysystolic form of AF.
- bradysystolic variant - contractions less than 60 beats per minute. (Fig. 3);
Photo 3: Bradysystolic form of AF.
With arrhythmia, contractions arise from different sections of muscle fibers, ectopic foci, as a result of which there is no single contraction of the atria. Against the background of hemodynamic failure, the right and left ventricles receive insufficient blood volume, cardiac output decreases, which determines the severity of the disease. Decoding the cardiogram helps to establish the exact heart rhythm disorder.
A characteristic sign of fibrillation on the ECG is f waves (large-wave and small-wave):
- in the first case, fibrillation is determined by large waves, atrial fibrillation reaches 300-500 per minute;
- in the second, the flicker waves become small, reaching 500-700 per minute.
Atrial flutter is a variant of slower contraction of the heart muscle, in the range of 200-300 beats per minute. Patients with persistent atrial fibrillation experience frequent flutter recurrences. Such an emergency requires urgent medical attention.
Analysis of cases of paroxysms shows that on average, in 10% of patients, an attack of atrial fibrillation turns into flutter, which is determined on the ECG in the form of the following description:
- the absence of P waves and the replacement of small f waves with large sawtooth waves F is the main characteristic, which is presented in photo 4;
- normal ventricular QRS complexes.
Pathological change
Long-term persistence of an elevated heart rate may indicate pathology. An increase in temperature of 1°C causes an increase in heart rate by 10 beats/min. Persistent tachycardia is associated with increased thyroid function, depression, neuroses and neurasthenia. Heart rate also increases as a result of myocardial damage, such as myocarditis, cardiomyopathy, and cardiosclerosis.
Bradycardia is sometimes associated with an infectious disease, especially a viral one. A decrease in heart rate can occur due to the use of certain medications, in particular beta-blockers and an overdose of drugs containing potassium. It may also be associated with myocardial infarction if death occurs in the posterior wall area.
The presence of a constant deviation of heart rate from the norm requires a detailed examination in order to identify the causes and, if possible, take measures to eliminate it.
Types of atrial fibrillation and an example of a diagnosis
Clinically, atrial fibrillation manifests itself in several forms:
- paroxysmal, when an attack of fibrillation lasts no more than 48 hours in the case of successful treatment (cardioversion), or paroxysm is restored within 7 days;
- persistent - arrhythmia lasts more than a week, or fibrillation can be eliminated later than 48 hours with drug therapy and electrical stimulation;
- permanent form, when chronic fibrillation is not eliminated by cardioversion. Drug assistance in this case is ineffective.
Taking into account the heart rate data and signs of typical atrial fibrillation on the ECG, three variants of fibrillation are determined:
- normosystolic form - heart rate within 60-100 beats per minute;
- tachysystolic - heart rate more than 90 beats per minute;
- bradysystolic - heart rate less than 60 beats per minute.
The clinical diagnosis of the patient includes the characteristics of the arrhythmia and ECG data, which are deciphered: atrial fibrillation, persistent form, tachysystolic variant.