Electrocardiography is an instrumental diagnostic method that allows one to study the electrical fields arising during heart contractions. The advantage of the method is its relative cheapness and the value of the data obtained during the procedure. With its help, it is possible to determine the heart rate, disturbances in the functioning of the myocardium and cardiac conduction, and assess the physical condition of the heart muscle.
During an ECG, a concept such as electrocardiographic leads (potential difference in electrocardiography) is used. When diagnosing heart disease, ECG leads are used in the arms, legs and sternum.
Indications for electrocardiography
The use of ECG is indicated in the following cases:
- during routine examinations, preventive examinations;
- to assess the condition of the heart muscle in patients before upcoming surgery;
- during examination of patients with diseases such as diabetes, pathologies of the lungs, thyroid gland, diseases of the endocrine system;
- for diagnosing arterial hypertension;
- during diagnosis of cardiac ischemia, atrial fibrillation, to determine which organ wall is affected;
- to identify heart defects in newborns and adult patients;
- when detecting disturbances in heart rhythm and conduction of cardiac impulses;
- to monitor the condition of the heart muscle during medical treatment.
Important! The norm or deviation of the obtained data is determined exclusively by a specialist with the necessary knowledge in this field.
ECG by Sky
In the Sky ECG technique, it is common to use only three electrodes. Red and yellow sensors are fixed in the fifth intercostal space. Red on the right side of the chest, yellow on the back of the axillary line. The green electrode is located on the line of the middle of the collarbone. Most often, an electrocardiogram according to the Sky is used to diagnose necrosis of the posterior heart wall (posterior basal myocardial infarction), and to monitor the condition of the heart muscles in professional athletes.
Schematic arrangement of the ventricles and atria, based on the location of which the electrodes are placed
Electric potential in ECG
Many patients are interested in why, when examining the heart muscle, the electrodes of the device are placed not only on the chest, but also in the limbs? To understand this, you should find out some features of the functioning of the organ. During contractions, the heart synthesizes certain electrical signals, creating a kind of electric field that spreads throughout the body, including the right and left limbs. These waves diverge throughout the body in concentric circles. When measuring the potential in any area, the electrocardiograph will show equal potential values. The same electrical potential at any point is called equipotential in medical practice. The above measurements are carried out in the area of the hands and feet.
During electrocardiography, special sensors are used that are fixed on the patient’s chest and limbs
Another such circle is the human chest. Electrocardiography data is often recorded from the surface of the heart muscle (during open surgery in the heart), from other parts of the organ’s conduction system, for example, from the His bundle and others. That is, recording the ECG line curve is performed by recording the electrical signals of the chest and limbs. In this case, doctors receive a cardiogram recorded in all leads, since the electrical potentials of the heart muscle are, as it were, diverted from certain parts of the body.
ECG technique: algorithm
Immediately before the scheduled registration of an ECG, the patient should not eat, smoke, drink stimulating drinks (tea, coffee, energy drinks), or exert any physical stress on the body.
We record in the necessary documentation the patient’s personal data, medical history number, date and time of the ECG.
We place the patient on the couch in a supine position. We degrease those areas of the skin where we will apply the electrodes - wipe them with a cloth soaked in an isotonic solution of sodium chloride (0.9%).
We apply electrodes: 4 plate electrodes - on the lower thirds of the inner surface of the legs and forearms, and on the chest - chest electrodes equipped with suction cups. For single-channel recording, 1 chest electrode is used, for multi-channel recording, several are used.
We connect wires of a certain color coming from the electrocardiograph to each electrode. Common markings for electrocardiograph wires:
- red - right hand;
- yellow - left hand;
- green - left leg;
- black - right leg (patient grounding);
- white - chest electrode.
When recording an ECG in 6 chest leads in the presence of a six-channel electrocardiograph, use the following tip markings:
- red - for connection to electrode V1;
- yellow - to V2;
- green to V3;
- brown - to V4;
- black - to V5;
- blue or purple - to V6.
Most often, the ECG is recorded in 12 leads:
- 3 standard (bipolar) leads (I, II, III);
- 3 reinforced unipolar leads;
- 6 chest leads.
Types of leads
The most commonly used is 12-lead ECG. These include:
- three standard leads;
- three reinforced;
- six leads from the chest.
A 12-lead ECG has diagnostic value and is used during electrocardiography to assess the condition of the heart and identify its various diseases.
Standard type leads
Each of the specific points of the electric field has its own potential. Electrocardiography allows you to record the potential difference at several measured points.
Standard leads are recorded as follows:
- Lead 1 – in this case, the positive electrode is fixed on the left hand, the negative electrode on the right hand;
- Lead 2 – sensor with a plus value on the left leg, negative electrode on the right hand;
- Lead 3 – a positive electrode is attached to the left leg, a negative electrode is attached to the left arm.
The indicators of the first, second and third leads are responsible for the work of one or another part of the heart muscle.
During an ECG, standard leads are considered the main type
Enhanced leads
The data is recorded by obtaining the difference between the electrical potential of one of the limbs, to the area of which the positive electrode is attached, and the average potentials of the other limbs.
Such leads in the diagram are designated by a combination of the letters aVF, aVL and aVR.
The connection of the electrical center of the heart muscle with the area of electrode attachment determines the axis of reinforced unipolar leads. This axis is divided into two equal parts. One of them is positive, directed towards the active electrode. The second is negative, directed towards the Goldberg electrode with a negative charge.
Thoracic leads
Electrocardiography leads in the chest area are designated by the letter V, proposed by Wilson. During electrocardiography, 6 chest leads are used. To do this, the electrode is placed on one or another point of the chest. ECG chest leads are schematically designated by a combination of Latin letters and numbers.
Electrode attachment area:
- area of the fourth intercostal section to the right of the chest – V1;
- area of the fourth intercostal section to the left of the chest - V2;
- the area between V2 and V4 – V3;
- midline of the clavicle and fifth intercostal space – V4;
- anterior axillary line and area of the fifth intercostal space – V5;
- the middle part of the axillary region and the space of the sixth intercostal space - V6.
Chest leads are located in the patient's sternum area
The use of a 12-lead ECG is the most common option. Electrocardiographic disturbances in each of them determine the overall electromotive force of the heart, that is, they are a consequence of the simultaneous influence on the discharge of the changing electrical potential in the walls of the heart, parts of the ventricles, the upper part of the organ and at its base.
Additional leads
To obtain more accurate information about the state of the heart muscle during electrocardiography, additional Neb leads are used. To carry out this type of diagnosis, sensors are used that are usually used for standard leads.
Neb lead data helps to identify pathological conditions associated with myocardial disorders in the posterior part of the organ, the anterior wall and the upper parts of the heart.
Important! Often additional leads are necessary to make a diagnosis for a particular disease.
Standard leads
Field points are characterized by the presence of their own energy. An ECG allows you to record differences between potentials at certain points in the sphere. The standard diagnostic scheme is performed in 3 stages:
- An electrode with a positive charge is placed on the left hand, and a negative one on the right.
- An electrode with a positive charge is fixed on the left leg, a sensor with a negative value is fixed on the right upper limb.
- A positive electrode is attached to the lower left limb, and a negative electrode is attached to the arm on the same side.
Based on the readings of all three leads, the specialist determines the performance of various parts of the organ. The corresponding connection on the device is indicated by “plus” or “minus” signs. The first, second and third connection diagram resemble an equilateral triangle in appearance. Each corner of the figure represents two arms and the patient’s left leg, to which electrodes are attached. In the center of Einthoven’s triangle there is an energy source, equidistant from all sides and corners of the figure. Based on the readings of all three leads, the specialist determines the performance of various parts of the organ.
Can an ECG using the Neb method completely replace a classic cardiogram?
How does an electrocardiograph work?
An electrocardiograph is a device designed to detect various pathologies and diseases of the heart muscle. The diagnostic method is based on obtaining the difference in electrical potentials. During normal heart function, this difference is weak or absent.
Most standard devices are equipped with 12 lead cables and 10 electrodes. During the procedure, 6 electrodes are attached to the patient’s chest, the remaining 4 are attached to the lower and upper extremities. Electrical impulses pass through the electrodes into the leads. In this case, the device records the data, recording it in the form of a graph. The resulting cardiogram is used to make a diagnosis.
An electrocardiograph is a device that allows you to record the electrical impulses of the heart on paper in the form of a graph.
Data decoding is carried out by a doctor, with their help the following indicators are determined:
- heart rate;
- cardiac conduction defects;
- which wall of the heart is affected;
- regularity of contractions;
- metabolic disturbances in the electrolyte balance of the organ;
- normal or pathological state of the myocardium;
- physical assessment of the condition of the heart muscle.
Electrocardiography allows you to identify both serious pathologies and heart defects, as well as minor disorders that do not require serious treatment.
More often, a standard scheme is used for diagnosis, but several types of electrocardiography can be used in medical practice:
We advise you to read: ECG for ischemic heart disease and angina pectoris
- intraesophageal - in this case, the patient is inserted into the esophagus with an active electrode. This type of study is used for the differential diagnosis of supraventricular disorders with ventricular ones;
- Holter electrocardiography – the procedure is repeated over a long period of time, recording and comparing the data obtained;
- bicycle ergometry – carrying out the procedure during physical activity on the body (using an exercise bike);
- high-resolution electrocardiography and other methods.
Each type of laboratory test is prescribed by a doctor in accordance with the characteristics of the disease and the patient’s indications.
Unipolar leads
With a unipolar lead, the recording electrode determines the potential difference between a specific point in the electric field (to which it is connected) and a hypothetical electric zero. The recording electrode in the unipolar lead is designated by the Latin letter V. By placing the recording unipolar electrode (V) in the position on the right hand, an electrocardiogram is recorded in lead VR. When the recording unipolar electrode is positioned on the left (Left) arm, the ECG is recorded in lead VL. The recorded electrocardiogram with the electrode position on the left leg (Foot) is designated as lead VF. Unipolar limb leads are displayed graphically on the ECG as small-height teeth due to a small potential difference. Therefore, for ease of decryption, they have to be strengthened. The word "enhanced" is written as "augmented" (English), the first letter is "a". By adding it to the name of each of the considered unipolar leads, we get their full name - enhanced unipolar limb leads aVR, aVL and aVF. In their name, each letter has a semantic meaning:
“a” - reinforced (from augmented) “V” - single-pole recording electrode; “R” — location of the electrode on the right (Right) hand; “L” — location of the electrode on the left (Left) hand; “F” is the location of the electrode on the leg (Foot).
Lead system
Do you need preparation for an ECG?
No specific preparation is required for an ECG, but in order to obtain the most correct results of the study, several aspects should be taken into account. The day before the diagnosis, experts recommend:
- sleep well;
- try to eliminate excessive emotional experiences;
- intra-nutritive electrocardiography is performed exclusively on an empty stomach;
- a few hours before the test, it is recommended to reduce fluid and food intake;
- During the diagnosis, you need to take off your clothes, relax, and not be nervous.
The day before the procedure, you should stop smoking and drinking alcohol.
During the ECG procedure, the patient is advised to relax and breathe evenly.
You should not engage in sports or heavy physical work. If you need to take certain medications, this must be discussed with your doctor. In addition, it is not recommended to visit a sauna, steam bath, or perform other procedures associated with the effects of heat on the body.
Important! No special preparation is required before performing an electrocardiogram, but following the above tips will help you obtain the most accurate data from any type of ECG.
Electrocardiogram. Part 1 of 3: Theoretical Basics of ECG
I’m starting the long-promised ECG cycle, which consists of 3 parts:
- theoretical foundations of ECG,
- ECG interpretation plan,
- some common pathological conditions on the ECG.
Required basic knowledge:
- cardiac conduction system (required),
- how the heart works (preferably).
The cycle was prepared based on the textbook “Electrocardiography” by V. V. Murashko and A. V. Strutynsky
, which is used in teaching medical students from the third year onwards.
This is an entry level guide. Practical work with ECG requires more in-depth knowledge, for example, the level of V. N. Orlov’s “Guide to Electrocardiography”
.
If you are not involved in medicine, but really want to understand a little about ECG, I recommend buying and mastering the book by Murashko and Strutynsky. The most important information is highlighted there separately, and questions and tasks for self-testing have answers
, which allows you to study on your own.
Electrocardiography
is a whole science that studies electrocardiograms (ECG), about which thick works and monographs are written. However, you can learn to distinguish a normal ECG from a pathological one. Mastery comes only with experience, when the number of deciphered ECGs reaches hundreds and thousands. At first, looking at each ECG will take up to 10-15 minutes, but experienced doctors and functional diagnostic specialists need no more than half a minute. The physical foundations of the ECG are studied in the first year of physics, and they begin to really decipher the ECG only in the third year of propaedeutics of internal diseases.
To understand the topic, you must know the conduction system of the heart, otherwise it will be extremely difficult to understand what processes are reflected on the ECG.
What exactly does the ECG machine record?
An electrocardiograph records the total electrical activity of the heart
, or more precisely, the difference in electrical potential (voltage) between 2 points.
Where does the potential difference arise
?
It's simple. At rest, myocardial cells are charged negatively from the inside and positively charged from the outside, while a straight line (= isoline) is recorded on the ECG tape. When an electrical impulse (excitation) arises and propagates in the conduction system of the heart, cell membranes move from a resting state to an excited state, changing polarity to the opposite (the process is called depolarization
).
In this case, the membrane becomes positive from the inside, and negative from the outside due to the opening of a number of ion channels and the mutual movement of K+ and Na+ ions (potassium and sodium) from and into the cell. After depolarization, after a certain time, the cells enter a resting state, restoring their original polarity (inside minus, outside plus), this process is called repolarization
.
The electrical impulse sequentially spreads throughout the parts of the heart, causing depolarization of myocardial cells. During depolarization, part of the cell becomes positively charged from the inside, and part is negatively charged. A potential difference arises
.
When the entire cell is depolarized or repolarized, there is no potential difference. The stage of depolarization corresponds to contraction of
the cell (myocardium), and the stage
of repolarization corresponds to relaxation
.
The ECG records the total potential difference from all myocardial cells, or, as it is called, the electromotive force of the heart
(cardiac emf). EMF of the heart is a tricky but important thing, so let’s return to it a little lower.
Schematic location of the cardiac EMF vector
(center) at one point in time.
ECG leads
As stated above, the electrocardiograph records the voltage (electrical potential difference) between 2 points
, that is, in some
lead
. In other words, the ECG device records on paper (screen) the magnitude of the projection of the electromotive force of the heart (cardiac emf) onto any lead.
Standard ECG is recorded in 12 leads
:
- 3 standard
(I, II, III), - 3 reinforced
from limbs (aVR, aVL, aVF), - and 6 chest
(V1, V2, V3, V4, V5, V6).
1) Standard leads
(suggested by Einthoven in 1913). I - between the left hand and the right hand, II - between the left foot and the right hand, III - between the left foot and the left hand.
simplest
(single-channel, i.e. recording no more than 1 lead at any time) the cardiograph has 5 electrodes:
red
(applied to the right hand),
yellow
(left hand),
green
(left leg),
black
(right leg) and chest ( sucker). If you start with the right hand and move in a circle, you can say that it is a traffic light. The black electrode represents “ground” and is needed only for safety purposes for grounding, so that a person does not get an electric shock in the event of a possible breakdown of the electrocardiograph.
Multichannel portable electrocardiograph
. All electrodes and suction cups differ in color and location.
2) Reinforced limb leads
(proposed by Goldberger in 1942). The same electrodes are used as for recording standard leads, but each of the electrodes in turn connects 2 limbs at once, and a combined Goldberger electrode is obtained. In practice, recording of these leads is done by simply switching the handle on a single-channel cardiograph (i.e., there is no need to rearrange the electrodes).
aVR
- enhanced abduction from the right hand (short for augmented voltage right - enhanced potential on the right).
aVL
- enhanced abduction from the left arm (left - left)
aVF
- enhanced abduction from the left leg (foot - leg)
3) Chest leads
(proposed by Wilson in 1934) are recorded between the chest electrode and the combined electrode from all 3 limbs. The chest electrode placement points are located sequentially along the anterolateral surface of the chest from the midline of the body to the left arm.
I don’t indicate too much detail, because it is not necessary for non-specialists. The principle itself is important (see figure). V1 - in the IV intercostal space along the right edge of the sternum. V2 V3 V4 - at the level of the apex of the heart. V5 V6 - along the left mid-axillary line at the level of the apex of the heart.
Location of 6 chest electrodes when recording an ECG
.
The 12 leads indicated are standard
.
additional
are “written” :
- according to Neb
(between points on the surface of the chest), - V7 - V9
(continuation of chest leads to the left half of the back), - V3R - V6R
(mirror reflection of chest leads V3 - V6 on the right [right] half of the chest).
Lead meaning
For reference: quantities can be scalar and vector. Scalar quantities only have magnitude
(numerical value), for example: mass, temperature, volume.
Vector quantities, or vectors, have both magnitude and direction
; for example: speed, force, electric field strength, etc. Vectors are indicated by an arrow above the Latin letter.
Why were so many leads
?
The EMF of the heart is the vector of the EMF of the heart in the three-dimensional world
(length, width, height) taking into account time. On a flat ECG film we can see only 2-dimensional values, so the cardiograph records the projection of the EMF of the heart on one of the planes in time.
Body planes used in anatomy
.
Each lead records its own projection of the cardiac EMF. First 6 leads
(3 standard and 3 enhanced from the limbs) reflect the EMF of the heart in the so-called
frontal plane
(see figure) and allow you to calculate the electrical axis of the heart with an accuracy of 30° (180° / 6 leads = 30°). The missing 6 leads to form a circle (360°) are obtained by continuing the existing lead axes through the center to the second half of the circle.
The relative position of standard and enhanced leads in the frontal plane
. But there is an error in the figure: aVL and lead III are NOT on the same line. Below are the correct drawings.
6 chest leads
reflect the EMF of the heart
in the horizontal (transverse) plane
(it divides the human body into upper and lower halves). This makes it possible to clarify the localization of the pathological focus (for example, myocardial infarction): interventricular septum, apex of the heart, lateral parts of the left ventricle, etc.
When analyzing an ECG, projections of the EMF vector of the heart are used, therefore such an ECG analysis is called vector
.
Note
. The material below may seem very complex. This is fine. When you study the second part of the series, you will return to it, and it will become much clearer.
Electrical axis of the heart (EOS)
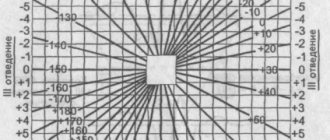
If you draw a circle
and draw lines through its center corresponding to the directions of three standard and three enhanced limb leads, then we obtain a
6-axis coordinate system
. When recording an ECG in these 6 leads, 6 projections of the total EMF of the heart are recorded, from which the location of the pathological focus and the electrical axis of the heart can be assessed.
Formation of a 6-axis coordinate system
. Missing leads are replaced by a continuation of existing ones.
Electrical axis of the heart
- this is a projection of the total electrical vector of the ECG QRS complex (it reflects the excitation of the ventricles of the heart) onto the frontal plane.
Quantitatively, the electrical axis of the heart is expressed by the angle?
between the axis itself and the positive (right) half of the axis of standard lead I, located horizontally.
It is clearly seen that the same EMF of the heart
in projections onto different leads gives different shapes of curves.
Determination rules
The positions of the EOS in the frontal plane are as follows: the electrical axis of the heart
coincides
with the one of the first 6 leads in which
the highest positive teeth
, and
is perpendicular
to the lead in which the size of the positive teeth
is equal to
the size of the negative teeth. Two examples of determining the electrical axis of the heart are given at the end of the article.
Variants of the position of the electrical axis of the heart:
- normal
: 30° > ? - vertical
: 70° > ? - horizontal
: 0° > ? - sharp axis deviation to the right
: 91° > ? - sharp axis deviation to the left
: 0° > ?
Options for the location of the electrical axis of the heart
in the frontal plane.
Normal electrical axis of the heart
approximately corresponds to its
anatomical axis
(in thin people it is directed more vertically from the average values, and in obese people it is directed more horizontally).
For example, with hypertrophy
(growth) of the right ventricle, the heart axis deviates to the right.
In case of conduction disturbances,
the electrical axis of the heart may deviate sharply to the left or right, which in itself is a diagnostic sign. For example, with a complete block of the anterior branch of the left bundle branch, a sharp deviation of the electrical axis of the heart to the left (? ? 30°) is observed, and the posterior branch to the right (? ? +120°).
Complete block of the anterior branch of the left bundle branch
.
The EOS is sharply deviated to the left
(? ?? 30°), because the highest positive waves are visible in aVL, and the equality of the waves is noted in lead II, which is perpendicular to aVL.
Complete block of the posterior branch of the left bundle branch
.
The EOS is sharply deviated to the right
(? ? +120°), because The tallest positive waves are seen in lead III, and the equality of the waves is noted in lead aVR, which is perpendicular to III.
Read further:
- Electrocardiogram. Part 2 of 3: ECG interpretation plan
- ECG part 3a. Atrial fibrillation and supraventricular paroxysmal tachycardia
Was the material useful? Share the link:
How is an ECG interpreted?
Cardiogram analysis is deciphered exclusively by a specialist. Indicators include P, Q, R, S, T waves and ST and PQ segments. In turn, teeth directed upward are called positive, and teeth directed downwards are called negative.
Key ECG indicators:
- the source of excitation under normal conditions is accompanied by sinus rhythm;
- rhythm frequency – the gap between the R waves is no more than 10%;
- normal heart rate is 60-80 beats/min;
- rotation of the electrical axis of the heart muscle - from semi-horizontal to semi-vertical;
- The R wave is accompanied by a positive character;
- T wave – must be positive;
- PQ section – from 0.02 to 0.09 sec;
- section ST – runs along the isoline; normally there may be deviations of no more than 0.5 mm.
Electrocardiography is a method often used in medical practice that allows one to obtain detailed information about the condition of the heart and some other organs in a short period of time. The data obtained during diagnosis is used to identify many diseases, help to start treatment in a timely manner, and prevent serious complications.
Chest leads
In addition to standard and unipolar limb leads, chest leads are also used in electrocardiographic practice. When recording an ECG in the chest leads, the recording unipolar electrode is attached directly to the chest. The electric field of the heart is strongest here, so there is no need to strengthen the unipolar chest leads, but this is not the main thing. The main thing is that the chest leads, as noted above, record electrical potentials from another equipotential circle of the heart’s electric field. Thus, to record an electrocardiogram in standard and unipolar leads, potentials were recorded from the equipotential circle of the electric field of the heart, located in the frontal plane (electrodes were placed on the arms and legs). When recording an ECG in the chest leads, electrical potentials are recorded from the circumference of the electrical field of the heart, which is located in the horizontal plane.
Change in the resulting vector in the frontal and horizontal planes. The places of attachment of the recording electrode on the surface of the chest are strictly specified: for example, when the recording electrode is positioned in the 4th intercostal space at the right edge of the sternum, the ECG is recorded in the first chest lead, designated as V1. Below is a diagram of the electrode location and the resulting electrocardiographic leads:
| Leads | Location of the recording electrode |
| V1 | in the 4th intercostal space at the right edge of the sternum |
| V2 | in the 4th intercostal space at the left edge of the sternum |
| V3 | halfway between V1 and V4 |
| V4 | in the 5th intercostal space at the midclavicular line |
| V5 | at the intersection of the horizontal level of the 5th intercostal space and the anterior axillary line |
| V6 | at the intersection of the horizontal level of the 5th intercostal space and the midaxillary line |
| V7 | at the intersection of the horizontal level of the 5th intercostal space and the posterior axillary line |
| V8 | at the intersection of the horizontal level of the 5th intercostal space and the midscapular line |
| V9 | at the intersection of the horizontal level of the 5th intercostal space and the paravertebral line |
Leads V7, V8, and V9 have not found wide application in clinical practice and are almost never used. The first six chest leads (V1-V6), along with three standard (I, II, III) and three reinforced unipolar leads (aVR, aVL, aVF), make up 12 generally accepted leads.
ECG recorded in 12 conventional leads
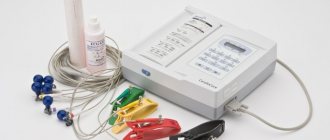
Electrocardiography apparatus
An electrocardiograph is used to conduct electrocardiography. This is a specialized medical device that records impulses that are transmitted from sensors attached to the patient’s body.
The main indicators are displayed on the screen in the form of a graph called an electrocardiogram. The cardiologist gets the opportunity to decipher the electrocardiogram data and establish a diagnosis for the patient.
The configuration of a modern electrocardiograph involves a signal amplifier, special electrodes, an anti-interference filter, and a switch-regulator. ECG devices used today in cardiology are distinguished by a high level of sensitivity to the bioelectrical activity of the heart.
Purpose of electrocardiography
Electrocardiography is one of the most important methods of general medical examination. For preventive purposes, the procedure is recommended to be performed periodically on all healthy patients.
For people with cardiovascular diseases, electrocardiography is required more often for constant monitoring of the condition.
The method should also be used in complex planned studies of patients with obesity, unstable heart rhythm, diabetes mellitus, and high blood pressure.
By taking an electrocardiogram, specialists can evaluate several parameters:
- disturbance of potassium and magnesium balance,
- completeness of blood supply to the myocardium,
- heart rate,
- thickening of the walls of the heart,
- infarction zones.
Symbols of an electrocardiogram
An electrocardiogram is a graphic image that represents a special broken curve with sharp teeth below and above a horizontal line with time cycles.
- The teeth on the electrocardiogram graph indicate the frequency and depth of changes in heart rhythm.
- The Latin letter “T” denotes the recovery phase between muscle contractions.
- The letter "P" denotes depolarization or excitation of the atria.
- The letter "U" denotes the recovery cycle of distant ventricles of the heart.
- The S, Q, R waves reflect the excitation of the ventricles in the electrocardiogram.
- Segments TP, ST, QRST – spaces between teeth.
- The pulse interval is the area of the electrocardiogram that covers a segment or wave.
Leads
Leads are circuits that record differences in indicators transmitted by electrodes. The electrocardiogram displays the characteristics of the heart muscle in various leads. This makes it possible to conduct an in-depth study of its condition and operation.
There are 3 main groups of leads. Please note the table below:
| Standard leads | Reinforced leads | Chest leads |
|
| 6 leads located between the ribs: V1, V2, V3, V4, V5, V6 . |
Correct technique for taking an ECG
The quality of electrocardiography will depend on proper fixation of the electrocardiograph sensors. It is necessary to study the technique of taking an ECG.
Preparing the patient and electrocardiograph
- Patient location. The patient needs to undress. The specialist needs to prepare a medical couch and ask him to lie on his back. If you feel unwell or have trouble breathing while lying down, the patient can take a different position. He will be examined in a sitting position.
- Treatment of the electrode application area. The skin is pre-wiped with alcohol and treated with a special gel that has conductive properties.
- Fixation of electrodes on the patient's body. The classic scheme for applying electrodes involves fixing them on the ankles, wrist and torso.
Number of electrodes
If a single-channel ECG recording is performed, then 1 chest electrode is usually sufficient. But for multi-channel recording, 6 pieces should be used.
Sensor color
To make it easier to navigate, each sensor has a specific color. Black is for the right leg, green is for the left leg, red is for the right arm and yellow is fixed on the left arm.
Electrode layout
Layout of the electrodes that record the chest leads:
| V1 | right side of the chest |
| V2 | left side of the chest |
| V3 | left parasternal arch near the fifth rib between electrodes V2 and V4 |
| V4 | at the intersection of the left vertical line, which is drawn on the anterior side of the chest through the projection of the center of the clavicle and the fifth intercostal space |
| V5 | left axillary line (anterior) |
| V6 | left axillary line (middle) |